Wednesday, January 29, 2014

AUD / JPY: Wednesday 29th January 2014. 11:24hrs

AUD / JPY:

AJ had been in a consolidation for most of 2014, with support at 91.00.

At the end of last week price broke through the support level at 91.00.

For the most part of this week price has retraced the move back to 91.00.
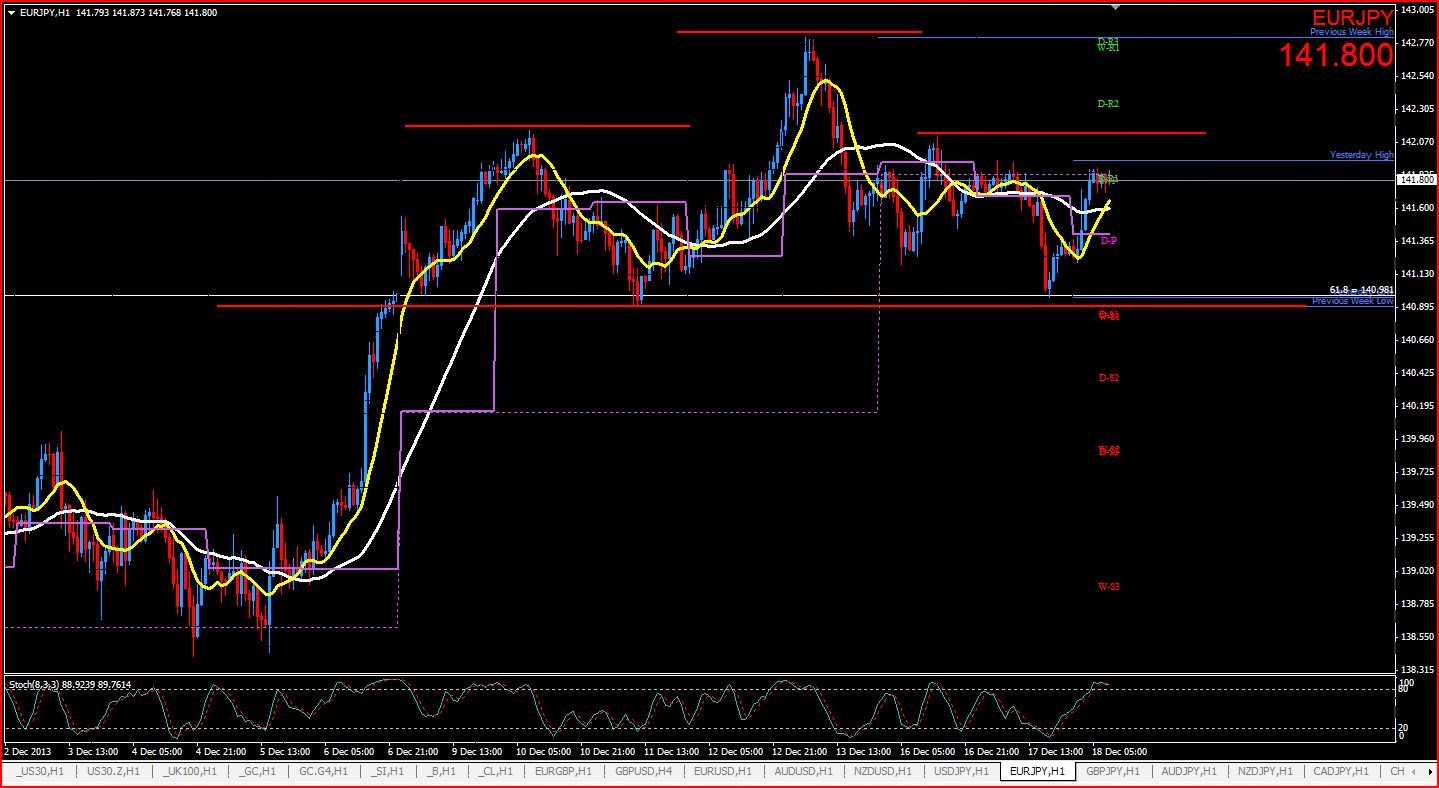
Chart below:

 
The retracement also coincides with the 61.8% Fibonacci level of the downward move.
 
This is a good place to look for shorts.
 
Once my averages have crossed over I will be looking to enter short after a pull back.
 
Chart below:
 
 
The targets for this position are as follows.
 
T1: 86.00
 
T2: 81.50
 
T3: 75.00
 
Once the averages have crossed and the pull back is taking place, I will post again with my entry and stop loss levels.
 
Have a great day.


Tuesday, January 14, 2014

GBP / USD: Tuesday 14th January 2014. 09:45hrs

GBP / USD:

Price has retraced as expected and picked up both orders at 1.6430 and 1.6410.

Following the inflation report price has made a move down allowing the stops to be moved to break even.

Chart below:


I have limit orders as previously discussed to scale out profits.

Monday, January 13, 2014

GBP / USD: Monday 13th January 2014. 16:06hrs

GBP / USD:

Sterling has come under pressure overnight and through the European trading sessions.

Cable has made a nice push lower and I am looking to enter short on a pull back to the averages and Fibonacci levels as shown below.

Chart and Levels below.

1st Entry: 1.6410
2nd Entry 1.6430

Averaged Entry: 1.6420

Stop Loss: 1.6470

1st Target: 1.6240
2nd Target: 1.6070
3rd Target: 1.5800

 
I will be risking 1% of my account as always.


Wednesday, December 18, 2013

EUR / JPY: Wednesday 18th December 2013. 07:49hrs

EUR / JPY:

The monthly chart shows a strong down trend with a pull back to 61.8% Fibonacci level at 142.00

Chart below:


All other time frames are showing a strong up trend.
 
Chart below:
 
 
There is a Head & Shoulders pattern on the 60 minute time frame.
 
Conclusion:
 
I will look for a new high above 143.00 with the immediate trend, a pull back and a long position.
 
Or
 
A break down through the neck line of the Head & Shoulders at 140.90 for short positions.
 
Chart below:
 
 
FOMC Economic predictions at 19:00hrs (UK time)
 
Best Regards
 
Mad Dog Trader.


Monday, December 02, 2013

EUR / USD: Monday 2nd December 2013. 10:17hrs

EUR / USD:

After retracing to the trend line resistance on the weekly time frame, EU has entered a Daily time frame down trend. Price has retraced over the past week to the 61.8% Fibonacci level.

Chart below:

 
As you can see price has been rejected from the 61.8% Fibonacci level.
 
This morning price has made a nice thrust move down through the averages and Pivot points and I am looking for a short position as detailed below.
 
Levels and Chart below:
 
Entry: 1.3575
 
Stop Loss: 1.3605
 
Target: 1.3425 (150 pips and a previous low. Also coincides with 2.618% Fibonacci extension).
 
 
I will update again should the position be opened.


Tuesday, November 26, 2013

GBP / USD: Tuesday 26th November 2013. 14:06hrs

GBP / USD:

Cable is in an up trend.

However price has been rejected from the resistance zone at 1.6250.

Price has moved away from the resistance at 1.6250 and has pulled back to to 50% Fibonacci level where it has been rejected again.

Chart below:

 
Following this mornings failed attempts at moving higher, price has broken down through the short term moving averages and has made a lower low on the 15 minute chart.

I am looking for a short position as detailed below.

Levels and Chart below:

Entry: 1.6160

Stop Loss: 1.6185

1st Target: 1.6105

2nd Target: 1.5900

 
I will update again should the position be opened.
 
Regards
 
Mad Dog Trader


Tuesday, November 19, 2013

EUR / USD: 19TH November 2013. 09:45hrs

EUR / USD:

EU is in a down trend.

Chart below:

 
On the Daily chart price has pulled back to the 61.8% Fibonacci level.
 
Chart below:
 
 
Price has now found resistance at 1.3540.
 
However for the time being price is supported by the trend line shown in the chart below.
 
Chart below:
 
 
Should price break through the trend line line I will be looking for a short entry on a pull back to this level.
 
I will update again with the entry levels, stop loss and targets when the price has shown its true direction.
 
Have a great day!!
 
Mad Dog.