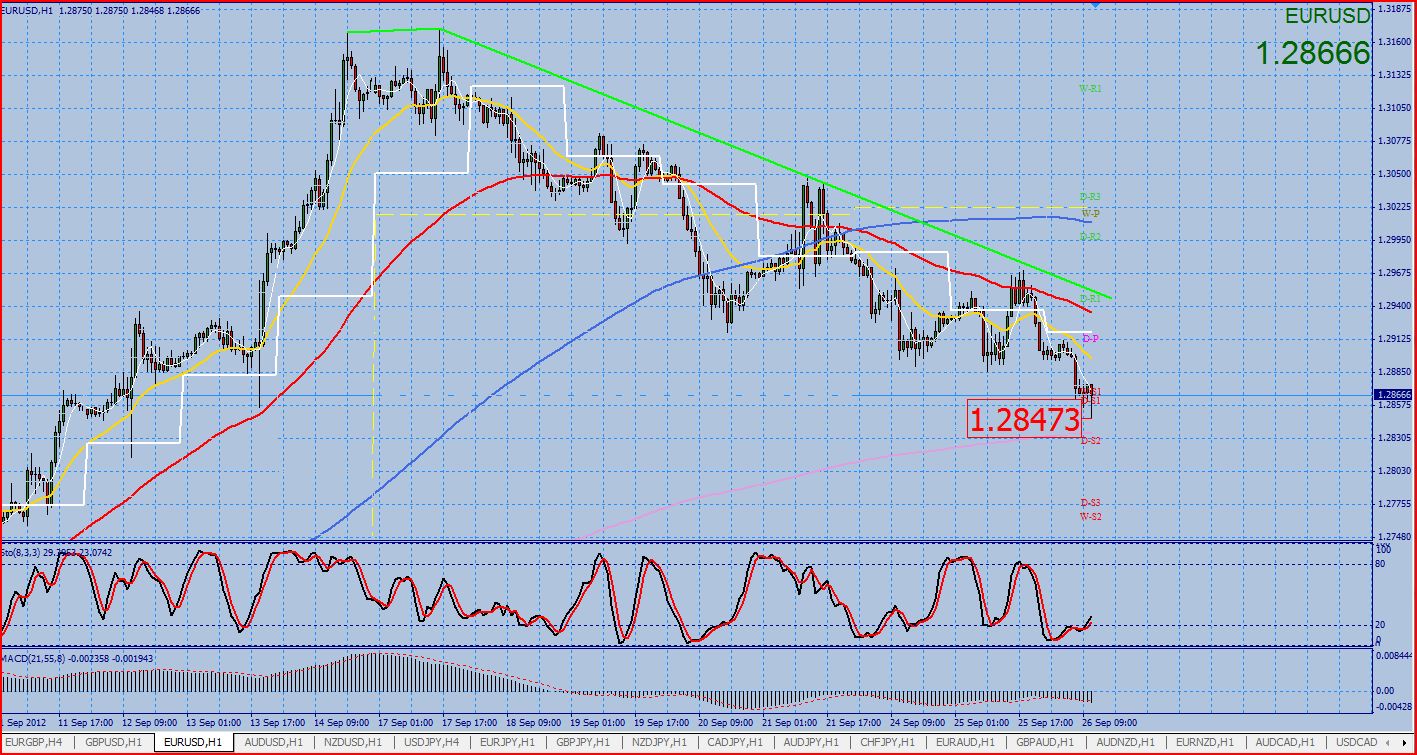
EUR / USD
Price has hit the target of 5% profit.
Chart below.
I will update again as soon as the next strategy trade develops
Regards
Wednesday, September 26, 2012
Thursday, September 20, 2012
EURO / USD: UPDATE Thursday 20th September 2012 04:58hrs
EUR / USD
As you can see from the chart below, I was stopped out by the spread or 1.2 pips.
Chart below:
Price has now made a move 50 pips lower and the trade would be in profit by 1.5%.
Stops have to go somewhere, its just a case of being lucky sometimes.
This is frustrating and it wont be that last time it happens, however it the important thing is that the trade was taken and the strategy showed direction.
Next time the trade will be a profitable one.
Have a good day and I will update again when the next strategy trade has been identified.
Regards
Wednesday, September 19, 2012
EUR / USD: Update Wednesday 19th September 2012 19:57
EUR / USD
Price has be unable to hold below the averages and I have been stopped by the spread for -1%
Chart below
Price has be unable to hold below the averages and I have been stopped by the spread for -1%
Chart below
I will update again when the next strategy trade has been identified.
Regards
EUR / USD: Wednesday 19th Septemebr 2012 13:54hrs
EUR / USD.
EUR / USD is in a down trend.
Price has recently pulled back the 78.6% Fibonacci level on the daily chart.
Price has also formed a double top on the 60 minute chart. A good sign that the market is looking to turn.
Price has made a new low and the Daily chart stochastic has also rolled over in the overbought region.
Daily Chart below:
60 Minute Chart below
Price has broken through the averages and the pivot points and I am looking to enter short on a pull back to the previous support region.
My entry levels and short term chart are below
1st Entry: 1.3035
2nd Entry: 1.3050
Averaged entry: 1.30425
Stop loss: 1.3075
Target: 1.2877 (5%)
Chart below
I will update again if and when the trade is triggered
Best regards
Thursday, September 13, 2012
AUD / JPY Update: Thursday 13th September 2012 13:54hrs
AUD / JPY
Price has been to within 5 pips of my sell order and moved down without me.
The chart entry was at 81.25. I made the first order as low as I could at 81.20 while still retaining a decent risk reward. Price came to 81.15 and moved back down.
Close but not close enough!!!
I have removed my OTO and remain flat.
Chart below
I will update again when the next strategy trade has been identified.
Best Regards
AUD / JPY Thursday 13th September 2012 10:35hrs
AUD / JPY
This pair has been in a down trend. Price has retraced to the 61.8% Fibonacci level.
Chart below
Price has formed a Double top pattern and this morning has broken down through the averages.
I am looking to enter short.
Chart below.
This pair has been in a down trend. Price has retraced to the 61.8% Fibonacci level.
Chart below
Price has formed a Double top pattern and this morning has broken down through the averages.
I am looking to enter short.
Chart below.
If price pulls back and the stochastic is in an overbought area, my orders will be as detailed below.
Levels and Chart below
1st Entry: 81.20
2nd Entry: 81.35
Averaged entry: 81.27
Stop Loss: 81.60
Target: 79.65 (5% and previous low)
Hope you are all well.
Regards
Subscribe to:
Posts (Atom)