Friday, June 28, 2013

GBP / JPY UPDATE: 28/06/20123. 07:58HRS

GBP / JPY:

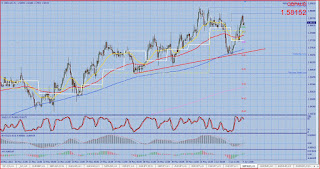
Sterling Yen has done what I had planned for it to do, namely make a new high and head up toward the target at 151.65.

Price is currently trading at 151.05.

Chart below:


It has been a slow week for the currencey crosses and the light volumme has cost me.
 
I had the right idea on this trade, but ideas dont pay bills.
 
I will update again when the next strategy trade has been identified.

Thursday, June 27, 2013

GBP / JPY UPDATE: 27/06/2013. 10:15HRS

GBP / JPY:

Price has not been able to hold above the averages and I have been stopped for -0.5%.

Price has not collapsed just pipped me out by 10 pips or so.

Chart below:


I removed the second order to buy at 151.10 as price action did not look favourable at the point of entry.

I will update again when the next strategy trade has been identified.


GBP / JPY: 27/06/2013. 09:24HRS

GBP / JPY:

Sterling Yen is in an uptrend.

Chart below:

 
Price has pulled back to the 50% Fibonacci level where is has found some support.
 
Chart below:
 
 
Price has now moved back up through the averages and I am looking for a long position with the trend.
 
Levels and Chart below:
 
1st Entry: 150.20
2nd Entry: 150.10
 
Averaged Entry: 150.15
 
Stop Loss: 149.85
 
1st Target: 151.65 (5%)
2nd Target: 154.00


I will update again should the position be opened.


Thursday, June 20, 2013

BRENT OIL UPDATE: 20/06/13. 15:25HRS

BRENT OIL:

Price pulled back, but not as far as I would have liked.

The high of the pull back was 105.05 or 15 pips shy of my first order at 105.20

Price has now made it way down and the target at 102.85 has been hit.

You will note from the chart, the stochastic did not return to the overbought area, therefore I was not really given much of a chance of a nice risk reward entry.

Chart below:


I will update again when the next strategy trade has been identified.

BRENT OIL: 20/06/13. 08:19HRS

BRENT OIL:

Brent is in a longer term down trend.

Chart below:


Price has formed a Triple top formation.
Price has broken down through support and the averages.
I am looking for a short position with the longer term trend as detailed below.

Levels and Chart below:

1st Entry: 105.20
2nd Entry: 105.50

Averaged Entry: 105.35

Stop Loss: 105.85

Target: 102.85


I will update again should the position be opened.


Wednesday, June 19, 2013

Cable: 19/06/13. 19:32hrs

Cable:

I tried Cable short through 1.5640 as I said I would.

However the FOMC statement produced a spike and I have been stopped at break even.

Price has now blown through the lows and is down at 1.5510.

Chart below:


I will update again when the next strategy trade has been identified


CABLE UPDATE: 19/06/13. 09:15HRS

CABLE:

Price has retraced and I have been stopped at break even.

Chart below:

 
The short term bias remain short.
 
Chart below:


Should price back down through 1.5640 I will look for a short position with a tight stop loss.
 
Chart below:


I will update again later this morning


CABLE UPDATE: 19/06/13. 06.10HRS

CABLE:

Price has held the 1.5650 area and has moved away back towards the previous low.

I have removed the second order to enter short.

I have also moved the stop loss to break even to eliminate the risk on the position.

Price has been down to 1.5616 and is trading at 1.5630 at the time of writing.

Chart below:


I will update again on this position later today.

Tuesday, June 18, 2013

CABEL UPDATE: 18/06/13. 19:35HRS

CABLE:

Price has retraced back to the first order at 1.5650.

I am currently short with 0.5% risk.

There is still a chance of a little more upside, therefore I will leave the second order in the market for the time being.

If price makes a move down from here, I will remove the second order and push the stop loss on the first position to break even.

For now, I am happy to hold.

Chart below:

 
I will update again tomorrow morning.
 
Have a great evening.
 

CABLE: 18/06/13. 12:58HRS

CABLE:

Cable (GBP / USD) is in a longer term down trend.

Chart below:

 
Price has retraced to the 61.8% Fibonacci level where is has found some resistance.
 
There is divergence on the oscillating indicators and price has this morning made a Lower Low.
 
Chart below:
 
 
I am looking for a short position with the long term trend as detailed below.
 
Levels and Charts below:
 
1st Entry: 1.5650
2nd Entry: 1.5670
 
Averaged Entry: 1.5660
 
Stop Loss: 1.5700
 
1st Target: 1.5460 (5%)
2nd Target: 1.5050 (Previous support & 15%)
 
 
I will update again should the position be opened.


Thursday, June 13, 2013

GOLD UPDATE: 13/06/13. 15:49HRS

GOLD:

Price has made a nice move down as expected.

The position was in profit by 70 pips.

I moved the stop loss to break even to eliminate the risk on the position.

However, there has been a spike in the gold market and I have been stopped at break even.

Chart below:

 
Sorry guys, but 70 pips is far enough from the entry not to have risk on the book.
 
Just the way it goes.....
 
I will update again when the next trade has been identified.


GOLD: 13/06/13. 10:45HRS

GOLD:

Gold is in a down trend.

Chart below:

 
Price has retraced back to the 61,8% Fibonacci Level.
Price has then moved lower back toward the 38.2% Fibonacci Level.
The red arrows show where price has hit a top or a bottom.
 
Chart below:


Price has now moved through the support, retraced to resistance in the form of the Weekly Pivot Point and 50% Fibonacci level.

Chart below:

 
There is a clear double top and a support level below.
 
If price breaks the support level I will enter a short with 0.5% risk.
 
I will look to add a further 0.5% on a pull back.
 
Levels and chart below:
 
Entry: 1383.00
 
Stop Loss: 1389.00
 
Target: 1.359.00
 
 
I will update again should the position be opened.


Wednesday, June 12, 2013

BRENT OIL UPDATE: 12/06/13. 06:46HRS

BRENT OIL:

Price has pulled back over night to a high of 103.03.

My first order was at 103.10.

I had a stop loss 103.90 which is 80 pips from the first entry.

If I had made the 1st Entry level 103.00 or 102.95 the risk reward just isn't there.

My orders have not been hit and they have been removed.

Price is now at 102.22.

Chart below:

 
I will update again when the next strategy trade has been identified.


Tuesday, June 11, 2013

CAD / JPY & GBP / JPY UPDATE: 11/06/13 18:47hrs

CAD / JPY & GBP / JPY:

Unfortunately price has not pulled back and made a new low.

I have removed my orders to short these crosses for the time being.

Charts below:

CAD / JPY:

 
GBP / JPY:


I will update again when the next strategy trade has been identified.


BRENT OIL: 11/06/13. 16:43HRS

BRENT OIL:

Brent is in a down trend.

There is a clear double top at 118.00 area.

Chart below:

 
Price has been making lower highs and lower lows.
 
Price has pulled back to the 38.2% Fibonacci level, it has been unable to break above this level on four occasions
 
Chart below:
 
 
Price has broken down through the averages today and I am looking for a short position as detailed below:
 
Levels Chart below:
 
1st Entry: 103.10
2nd Entry: 103.40
 
Averaged Entry: 103.25
 
Stop Loss: 103.90
 
1st Target: 100.00
2nd Target: 96.80
 
 
I will update again should the position be opened.


GBP / JPY: 11/06/13. 15:28HRS

GBP / JPY:

GJ has a Double Top pattern in play.

Price broken down and has retraced to resistance.

Chart below:


Price has been going sideways for a few days but has now broken down.
 
I am looking for a short position when price pulls back as detailed below:
 
Levels and Chart below:
 
1st Entry: 152.10
2nd Entry: 152.30
 
Averaged Entry: 152.20
 
Stop Loss: 152.80
 
1st Target: 149.20
2nd Target: 147.50
 
 
I will update again if and when the position is opened.


CAD / JPY: 11/06/13. 14:22HRS

CAD / JPY:

CJ has been in an up trend as have all the Yen crosses.

Price has recently broken through a trend line that was acting as a support level.

There is also divergence between the oscillating indicators and price.

Chart below:

 
Price has been making lower highs and lower lows the past 3 weeks.
 
Price has also formed a Double top pattern on a 60 minute time frame. (Green Line)
 
Chart below:
 
 
Price has this morning broken down and I am looking for a short position on a pull back as detailed below.
 
Levels and Chart below:
 
1st Entry: 95.80
2nd Entry: 95.90
 
Averaged Entry: 95.85
 
Stop Loss: 96.30
 
1st Target: 93.60
2nd Target: 89.50
 
 
I will update again should the trade be triggered.

Thursday, June 06, 2013

EUR / JPY & GBP / AUD UPDATE: 06.06.13. 17:56HRS

EUR / JPY:

As you know I was stopped out for break even on this trade yesterday.

This has proved very costly indeed.

The trade has just hit the 2nd target for a profit of 5.25% with only 0.5% risk.

Chart below:

 
GBP / AUD:
 
Allthough I didn't even get an entry on this trade, I thought I would show you the chart.
 
Price has hit the second target of 1.6140 for 9.25% and continued on a further 150 pips for 13%
 
Now, I know I would be out at the second target, but thought I would share it with you.
 
Chart below:
 
 
I will update again when the next strategy trade has been identified.


Wednesday, June 05, 2013

EUR / JPY UPDATE: 05.06.13. 09:07HRS

EUR / JPY:

Price has pulled back to 130.61 and I am short with 0.5% exposure to the market.

Price has now moved away from the entry by 25 pips and I have moved the stop loss to break even to eliminate the risk on this position.

I have removed my second order.

Chart below:

 
There is a data release at 10:00hrs in the form of EUR GDP, I am hoping this will give the position the push it requires to move into a decent profit.
 
I will update again later today.


GBP / AUD UPDATE: 05.06.13 07:28HRS

GBP / AUD:

As you know my orders did not get hit yesterday on this trade.

I had an order to buy GBP / AUD at 1.5780. Price only came to 1.5792.

Price has now hit the first target at 1.5970 and is looking good for the the second target.

You can see from the chart below, at no point has this pair become oversold or even close to it.

Just a shame it wouldn't give me the entry with a good risk reward.

Chart below:

 
I will update again when the next strategy trade has been identified.


EUR / JPY: 05.06.13. 07:08HRS.

EUR / JPY:

EJ has been making lower highs and lower lows on the medium term time frame.

Chart below:


There is also divergence between the oscillating indicators and price.

Chart below:

 
There is a double top formation on the short term charts.
Price has broken down through the averages this morning.
I am looking for a short position on a pull back to the averages as detailed below.
 
Levels and Chart below:
 
1st Entry: 130.60
2nd Entry: 130.70
 
Averaged Entry: 130.65
 
Stop Loss: 130.95
 
1st Target: 129.15
2nd Target: 127.50
 
 
I will update again should the trade be triggered.


Tuesday, June 04, 2013

GBP / AUD UPDATE: 04.06.13. 16:31HRS

GBP / AUD:

Price has pulled back but not as far as I would have liked.

The pull back only came to 1.5792 or 12 pips short of my first entry.

I have removed the orders to enter long for now.

Chart below:


I will update again when the next strategy trade has been identified.


GBP / AUD: 04.06.13. 13:04HRS

GBP / AUD:

GBP / AUD is in an up trend.

Chart below:

 
Price has pulled back and found support off the red trend line shown in the chart below.
 
Chart below:


Price has now moved back up through the averages and I am looking for a long position as detailed below.
 
Levels and Chart below:
 
1st Entry: 1.5780
2nd Entry: 1.5760
 
Averaged Entry: 1.5770
 
Stop Loss: 1.5730
 
1st Target: 1.5970
2nd Target: 1.6140


I will update again should the trade be triggered.