Tuesday, November 26, 2013

GBP / USD: Tuesday 26th November 2013. 14:06hrs

GBP / USD:

Cable is in an up trend.

However price has been rejected from the resistance zone at 1.6250.

Price has moved away from the resistance at 1.6250 and has pulled back to to 50% Fibonacci level where it has been rejected again.

Chart below:

 
Following this mornings failed attempts at moving higher, price has broken down through the short term moving averages and has made a lower low on the 15 minute chart.

I am looking for a short position as detailed below.

Levels and Chart below:

Entry: 1.6160

Stop Loss: 1.6185

1st Target: 1.6105

2nd Target: 1.5900

 
I will update again should the position be opened.
 
Regards
 
Mad Dog Trader


Tuesday, November 19, 2013

EUR / USD: 19TH November 2013. 09:45hrs

EUR / USD:

EU is in a down trend.

Chart below:

 
On the Daily chart price has pulled back to the 61.8% Fibonacci level.
 
Chart below:
 
 
Price has now found resistance at 1.3540.
 
However for the time being price is supported by the trend line shown in the chart below.
 
Chart below:
 
 
Should price break through the trend line line I will be looking for a short entry on a pull back to this level.
 
I will update again with the entry levels, stop loss and targets when the price has shown its true direction.
 
Have a great day!!
 
Mad Dog.


Wednesday, November 13, 2013

GBP / USD: Monday 11th November 2013. 07:00hrs

GBP / USD:

Cable is currently retracing in an up trend.

There is a Double top formation on the daily chart at 1.6250.

Chart below:


Price has now pulled back to the 61.8% Fibonacci level and found resistance at this level of 1.6120.
 
 
Price has now broken down through the averages. This is my signal to enter a short position on a pull back as detailed below.
 
Levels and Chart below:
 
1st Entry: 1.6010
2nd Entry 1.6030
 
Averaged entry: 1.6020
 
Stop Loss: 1.6060 (40 Pips)
 
1st Target: 1.5860 (161.8% Fibonacci extension) 160 pips 4/1 Risk reward
2nd Target: 1.5700 (261.8 Fibonacci extension) 320 pips 8/1 Risk reward


As you can see from the chart below, the position was opened and the 1st target has been hit.
 
You have the option to hold the position to the second target or closed the whole position at the first target for a risk reward of 4/1.
 
Chart below:
 
 
This is a typical example of how I trade.
 
If you would like to know more then please email me at scott@maddogtrader.co.uk


Wednesday, November 06, 2013

AUD / USD UPDATE: Wednesday 6th November 2013. 06:23hrs

AUD / USD:

Price has retraced and collected the first order at 0.9510.

Price has then drifted until a small spike down hit the stop loss exactly at 0.9480.

Price has now made the move up and is trading at 0.9521.

I have been stopped out for -0.5% and yet I was correct with the direction and timing of the trade.

I will work on a better level for the stops.

Chart below:


AUD / JPY Update:
 
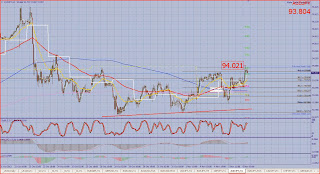
Price has now moved up and is trading at 93.95. My entry was at 93.40.
 
This one also hit the stop perfectly, although I was able to reduce the risk down to 0.16%
 
Chart below:
 
 
I will update again when the next strategy trade has been identified.


Tuesday, November 05, 2013

AUD / JPY UPDATE: Tuesday 5th November 2013. 15:59hrs

AUD / JPY:

AJ has messed around as have all the currencies.

Price has retraced back down to a low of 92.95 (the original stop loss)

It has then rallied back up and is currently at the entry level.

During this I have been stopped for a loss of -0.16% (15 pips)

If I had held the stop loss at the original level, I would have been stopped for -0.5%.

Chart below:


I will update again when the next strategy trade has been identified.

AUD / USD: Tuesday 5th November 2013. 13:21hrs

AUD / USD:

AU is in an uptrend.

Chart below:

 
Price has recently pulled back and found support in the form of a trend line. and Fibonacci level.
 
There is Divergence showing on the Oscillating indicators.
 
Chart below:
 
 
Price has this morning broken up through the averages and made a new high.
 
I am looking for a long position as detailed below.
 
Levels and Chart below:
 
1st Entry: 0.9510
2nd Entry: 0.9500
 
Stop Loss: 0.9480
 
1st Target: 0.9630 (5%)
2nd Target: 0.9730 (9% Previous Highs)
 
 
I will update again if the position is opened.


AUD / JPY UPDATE: Tuesday 5th November 2013. 07:39hrs

AUD / JPY:

AJ has moved up to a high of 93.36.

I have moved the stop loss up to just below the previous swing low at 93.25.

There is now only 145 pips or 0.16% risk on this position.

Chart below:


I will update again when the next strategy trade has been identified.


AUD / JPY UPDATE: Tuesday 5th November 2013. 06:41hrs

AUD / JPY:

AJ has retraced over night and has triggered the first order at 93.40.

I am long with 0.5% exposure to the market.

I have been able to move the stop loss up to 93.10 removing some but not all of the risk.

There remains 0.33% risk on this position.

Chart below:

 
I will update again when the next strategy trade has been identified


Monday, November 04, 2013

AUD / JPY: Monday 4th November 2013. 07:42hrs.

AUD / JPY:

AJ is in an uptrend.

Chart below:


Price has pulled back to the 61.8% Fibonacci level, where it has formed a double bottom.

Chart below:

 
Price has now begun to move back up with the trend and I am looking for a long position as detailed below.
 
Levels and Chart below:
 
1st Entry: 93.40
2nd Entry: 93.30
 
Averaged entry: 93.32
 
Stop Loss: 93.95
 
1st Target: 95.35 (5% & previous high)
2nd Target: 98.00 (11.63% projected target)


I will update again should the position be opened.