Wednesday, December 18, 2013

EUR / JPY: Wednesday 18th December 2013. 07:49hrs

EUR / JPY:

The monthly chart shows a strong down trend with a pull back to 61.8% Fibonacci level at 142.00

Chart below:


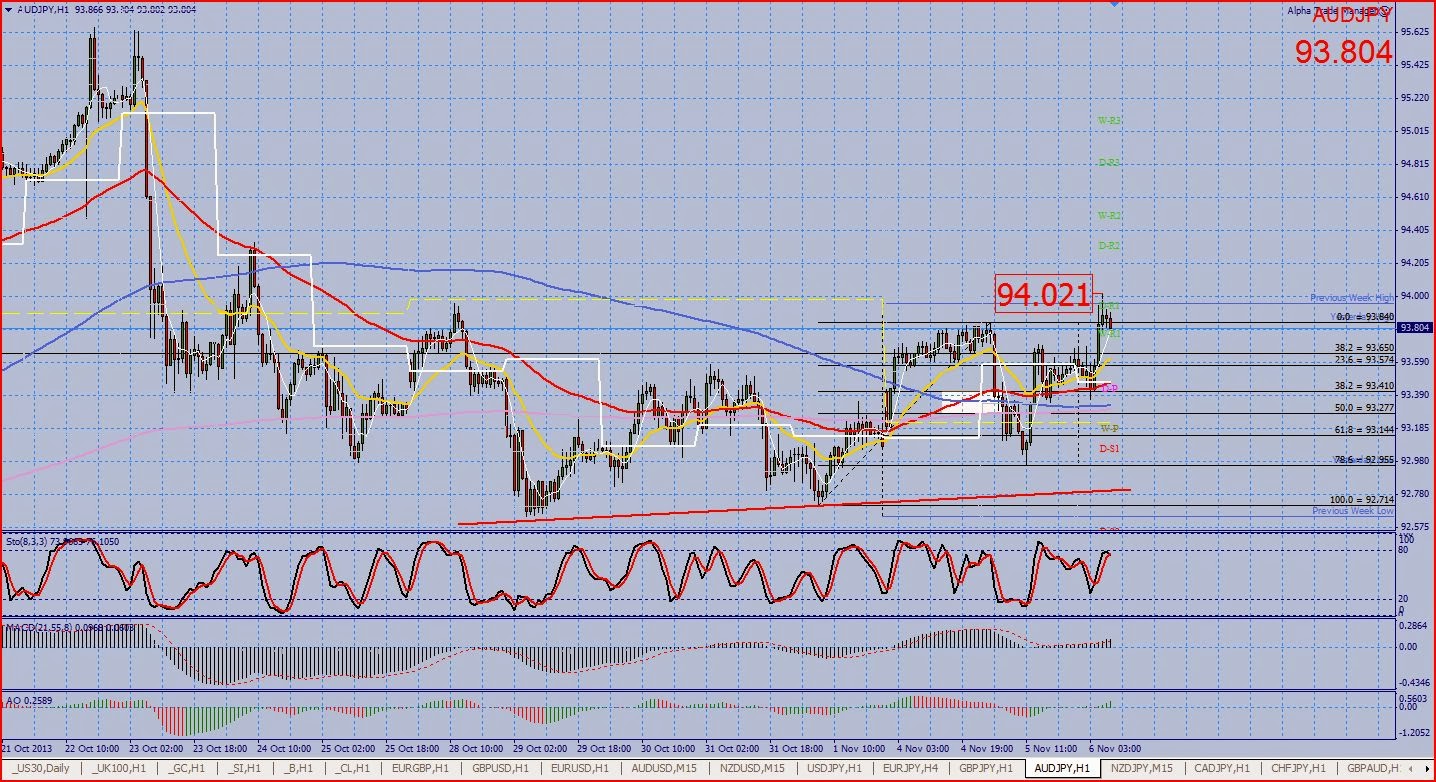
All other time frames are showing a strong up trend.
 
Chart below:
 
 
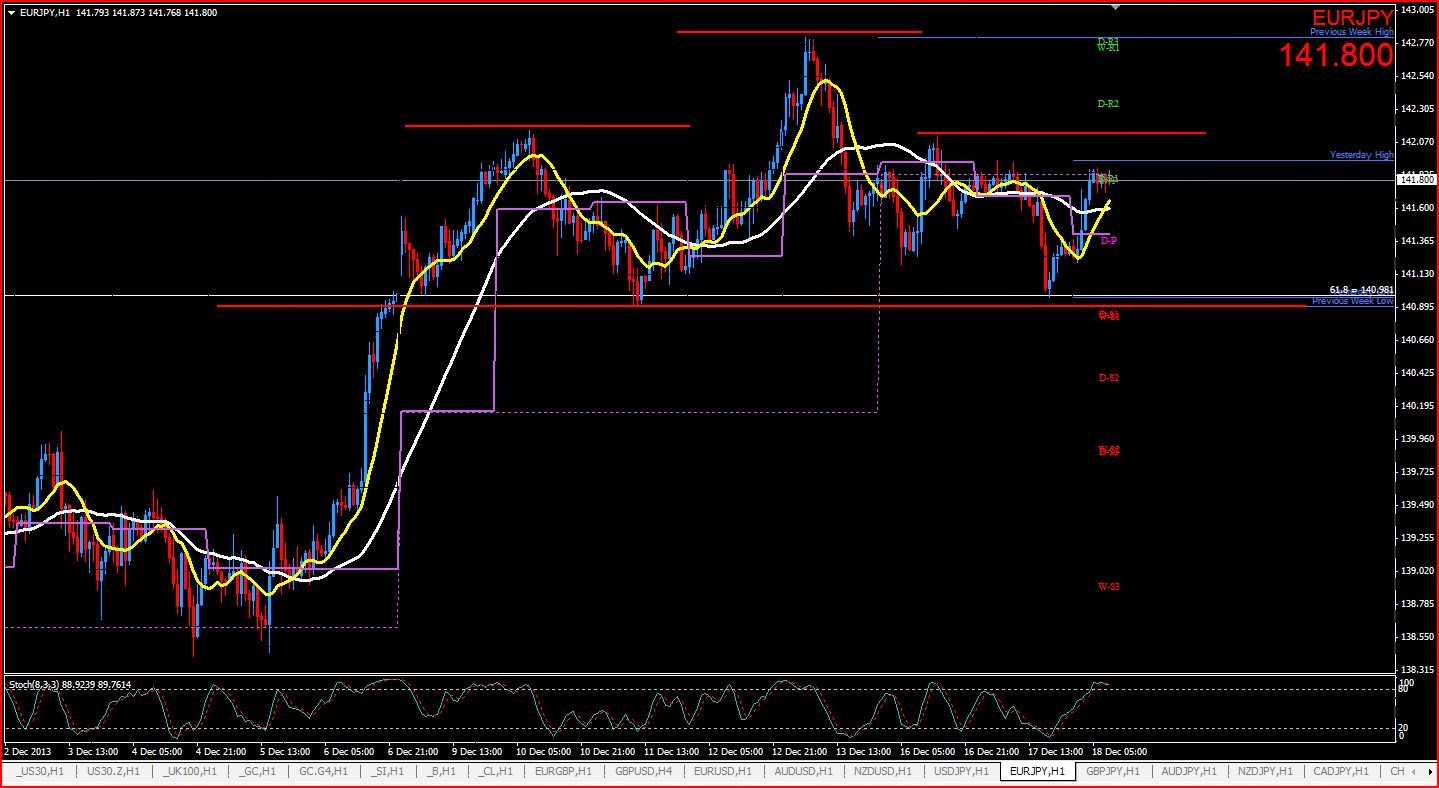
There is a Head & Shoulders pattern on the 60 minute time frame.
 
Conclusion:
 
I will look for a new high above 143.00 with the immediate trend, a pull back and a long position.
 
Or
 
A break down through the neck line of the Head & Shoulders at 140.90 for short positions.
 
Chart below:
 
 
FOMC Economic predictions at 19:00hrs (UK time)
 
Best Regards
 
Mad Dog Trader.


Monday, December 02, 2013

EUR / USD: Monday 2nd December 2013. 10:17hrs

EUR / USD:

After retracing to the trend line resistance on the weekly time frame, EU has entered a Daily time frame down trend. Price has retraced over the past week to the 61.8% Fibonacci level.

Chart below:

 
As you can see price has been rejected from the 61.8% Fibonacci level.
 
This morning price has made a nice thrust move down through the averages and Pivot points and I am looking for a short position as detailed below.
 
Levels and Chart below:
 
Entry: 1.3575
 
Stop Loss: 1.3605
 
Target: 1.3425 (150 pips and a previous low. Also coincides with 2.618% Fibonacci extension).
 
 
I will update again should the position be opened.


Tuesday, November 26, 2013

GBP / USD: Tuesday 26th November 2013. 14:06hrs

GBP / USD:

Cable is in an up trend.

However price has been rejected from the resistance zone at 1.6250.

Price has moved away from the resistance at 1.6250 and has pulled back to to 50% Fibonacci level where it has been rejected again.

Chart below:

 
Following this mornings failed attempts at moving higher, price has broken down through the short term moving averages and has made a lower low on the 15 minute chart.

I am looking for a short position as detailed below.

Levels and Chart below:

Entry: 1.6160

Stop Loss: 1.6185

1st Target: 1.6105

2nd Target: 1.5900

 
I will update again should the position be opened.
 
Regards
 
Mad Dog Trader


Tuesday, November 19, 2013

EUR / USD: 19TH November 2013. 09:45hrs

EUR / USD:

EU is in a down trend.

Chart below:

 
On the Daily chart price has pulled back to the 61.8% Fibonacci level.
 
Chart below:
 
 
Price has now found resistance at 1.3540.
 
However for the time being price is supported by the trend line shown in the chart below.
 
Chart below:
 
 
Should price break through the trend line line I will be looking for a short entry on a pull back to this level.
 
I will update again with the entry levels, stop loss and targets when the price has shown its true direction.
 
Have a great day!!
 
Mad Dog.


Wednesday, November 13, 2013

GBP / USD: Monday 11th November 2013. 07:00hrs

GBP / USD:

Cable is currently retracing in an up trend.

There is a Double top formation on the daily chart at 1.6250.

Chart below:


Price has now pulled back to the 61.8% Fibonacci level and found resistance at this level of 1.6120.
 
 
Price has now broken down through the averages. This is my signal to enter a short position on a pull back as detailed below.
 
Levels and Chart below:
 
1st Entry: 1.6010
2nd Entry 1.6030
 
Averaged entry: 1.6020
 
Stop Loss: 1.6060 (40 Pips)
 
1st Target: 1.5860 (161.8% Fibonacci extension) 160 pips 4/1 Risk reward
2nd Target: 1.5700 (261.8 Fibonacci extension) 320 pips 8/1 Risk reward


As you can see from the chart below, the position was opened and the 1st target has been hit.
 
You have the option to hold the position to the second target or closed the whole position at the first target for a risk reward of 4/1.
 
Chart below:
 
 
This is a typical example of how I trade.
 
If you would like to know more then please email me at scott@maddogtrader.co.uk


Wednesday, November 06, 2013

AUD / USD UPDATE: Wednesday 6th November 2013. 06:23hrs

AUD / USD:

Price has retraced and collected the first order at 0.9510.

Price has then drifted until a small spike down hit the stop loss exactly at 0.9480.

Price has now made the move up and is trading at 0.9521.

I have been stopped out for -0.5% and yet I was correct with the direction and timing of the trade.

I will work on a better level for the stops.

Chart below:


AUD / JPY Update:
 
Price has now moved up and is trading at 93.95. My entry was at 93.40.
 
This one also hit the stop perfectly, although I was able to reduce the risk down to 0.16%
 
Chart below:
 
 
I will update again when the next strategy trade has been identified.


Tuesday, November 05, 2013

AUD / JPY UPDATE: Tuesday 5th November 2013. 15:59hrs

AUD / JPY:

AJ has messed around as have all the currencies.

Price has retraced back down to a low of 92.95 (the original stop loss)

It has then rallied back up and is currently at the entry level.

During this I have been stopped for a loss of -0.16% (15 pips)

If I had held the stop loss at the original level, I would have been stopped for -0.5%.

Chart below:


I will update again when the next strategy trade has been identified.

AUD / USD: Tuesday 5th November 2013. 13:21hrs

AUD / USD:

AU is in an uptrend.

Chart below:

 
Price has recently pulled back and found support in the form of a trend line. and Fibonacci level.
 
There is Divergence showing on the Oscillating indicators.
 
Chart below:
 
 
Price has this morning broken up through the averages and made a new high.
 
I am looking for a long position as detailed below.
 
Levels and Chart below:
 
1st Entry: 0.9510
2nd Entry: 0.9500
 
Stop Loss: 0.9480
 
1st Target: 0.9630 (5%)
2nd Target: 0.9730 (9% Previous Highs)
 
 
I will update again if the position is opened.


AUD / JPY UPDATE: Tuesday 5th November 2013. 07:39hrs

AUD / JPY:

AJ has moved up to a high of 93.36.

I have moved the stop loss up to just below the previous swing low at 93.25.

There is now only 145 pips or 0.16% risk on this position.

Chart below:


I will update again when the next strategy trade has been identified.


AUD / JPY UPDATE: Tuesday 5th November 2013. 06:41hrs

AUD / JPY:

AJ has retraced over night and has triggered the first order at 93.40.

I am long with 0.5% exposure to the market.

I have been able to move the stop loss up to 93.10 removing some but not all of the risk.

There remains 0.33% risk on this position.

Chart below:

 
I will update again when the next strategy trade has been identified


Monday, November 04, 2013

AUD / JPY: Monday 4th November 2013. 07:42hrs.

AUD / JPY:

AJ is in an uptrend.

Chart below:


Price has pulled back to the 61.8% Fibonacci level, where it has formed a double bottom.

Chart below:

 
Price has now begun to move back up with the trend and I am looking for a long position as detailed below.
 
Levels and Chart below:
 
1st Entry: 93.40
2nd Entry: 93.30
 
Averaged entry: 93.32
 
Stop Loss: 93.95
 
1st Target: 95.35 (5% & previous high)
2nd Target: 98.00 (11.63% projected target)


I will update again should the position be opened.


Thursday, October 24, 2013

GBP / USD UPDATE: THURSDAY 24TH OCTOBER 2013. 16:52HRS.

GBP / USD:

Following the initial move first thing this morning price has done very little.

On the back of this I have been stopped at break even.

Chart below:

 
I will update again when the next strategy trade has been identified.


GBP / USD UPDATE: THURSDAY24TH OCTOBER 2013. 07:15HRS

GBP / USD:

Cable has moved up and my order has been hit.

I am long from 1.6205 with 0.5% exposure to the market with now risk

Although price is still close to the entry, I have been able to move the stop loss to break even to eliminate the risk on the position.

Chart below:

 
I have a limit order at 1.6330 for 5% profit.
 
I will update again later today.


GBP / USD: THURSDAY 24TH OCTOBER 2013. 06:55HRS

GBP / USD:

Cable is in an uptrend.

Chart below:


Price has pull back and formed a double bottom on the 4hr chart.
 
Chart below:
 
 
Price has now broken back up through the averages and I am looking for a long position as detailed below.
 
Levels and Chart below:
 
Entry: 1.6205
 
Stop Loss: 1.6180
 
Target: 1.6330.


I will update again should the position be opened.


Friday, October 18, 2013

GBP / USD UPDATE: FRIDAY 18TH OCTOBER 2013. 07:41HRS

GBP / USD:

Cable has hit the target for 5%

Chart below:

 
I will update again when the next strategy trade has been identified.


Thursday, October 17, 2013

GBP / USD UPDATE: 17TH OCTOBER 2013. 09:53HRS

GBP / USD:

Cable has made a new high and is looking good for the target at 1.6182

Chart below:

 
Even in hindsight it is very hard to see what I could have done different.
 
I will update again when the next strategy trade has been identified.


Wednesday, October 16, 2013

GBP / USD UPDATE: WEDNESDAY 16TH OCTOBER 2013. 19:33HRS

GBP / USD:

Price has not been able to hold above the averages and I have been stopped for -1%

Chart below:


I will update again when the next strategy trade has been identified.


GBP / USD: WEDNESDAY 16TH OCTOBER 2013. 14:52HRS

GBP / USD:

Cable is in an up trend.

Chart below:


Price has pulled back and is supported above 1.5900.
 
Price has this morning broken up through the averages and I am looking for a long position as detailed below.
 
Levels and chart below:
 
1st Entry: 1.6005
2nd Entry: 1.5990
 
Averaged Entry: 1.5997
 
Stop Loss: 1.5960
 
Target: 1.6182


I will update again should the position be opened.


Thursday, October 10, 2013

AUD / JPY UPDATE: THURSDAY 10TH OCTOBER 2013. 14:44HRS

AUD / JPY:

AJ has broken through the highs and is currently trading at 92.75.

The target for my position was at 92.75 for 5%.

Chart below:


I will update again when the next strategy trade has been identified.


Tuesday, October 08, 2013

AUD / JPY UPDATE: TUESDAY 8TH OCTOBER 2013. 20:34HRS

AUD JPY:

AJ has retraced to the order level.

price has broken through the averages and I have been stopped by 0.2 of a pip.

The low is 91.248.

Chart below:


Price is now back at 91.55 or the entry level.
 
I will update again when the next strategy trade is identified.


AUD / JPY: TUESDAY 8TH OCTOBER 2013. 10:46HRS

AUD / JPY:

AJ is in an up trend.

Chart below:


Price has pulled back and found support.
 
Price has now broken up through the averages and I am looking for a long position as detailed below.
 
Levels and Chart below:
 
Entry: 91.55 (1%)
 
Stop Loss: 91.30
 
Target: 92.80


I will update again should the position be opened.


Wednesday, October 02, 2013

AUD / USD UPDATE: WEDNESDAY 2ND OCTOBER 2013. 06:21HRS

AUD / USD:

Price has made an attempt to move higher over night.
The position has been in profit by 0.5% but is stalling.
There is a cross of the short term averages against the position.

I have therefore decided to close the position at break even.

Chart below:


I will look to reenter a long position if and when price action show so upside momentum.


Tuesday, October 01, 2013

GOLD UPDATE: TUESDAY 1ST OCTOBER 2013. 16:05HRS

GOLD:

Has has made the move down and the first target has been hit.

Chart below:


AUD / USD UPDATE: TUESDAY 1ST OCTOBER 2013. 15:14HRS

AUD / USD:

Price has retraced back to the order levels.

I am long from 0.9380 with 0.5% exposure to the market.

Price has moved away from the entry by 20 pips.

This has allowed me to move the stop loss to break even and eliminate the risk on the position.

I have removed the second order.

Chart below:


I will update again later this evening

AUD / USD: TUESDAY 1ST OCTOBER 2013. 10:03HRS

AUD / USD:

AU is in a medium term up trend.

Chart below:

 
There is a double bottom formation and price has broken up through the averages.
 
I am looking for a long position as detailed below.
 
Levels and Chart below.
 
1st Entry: 0.9380
2nd Entry: 0.9360

Averaged entry: 0.9370

Stop Loss: 0.9330

1st Target: 0.9570
2nd Target: 0.9700

 
I will update again should the position be opened.


Monday, September 30, 2013

GOLD UPDATE: MONDAY 30TH SEPTEMBER 2013. 19:01HRS

GOLD:

Price has retraced as expected. The first order has been hit.

I have removed the second order.

Price retraced 6 pips higher than I wanted and it has hit my stop loss for -0.5%

Price has now moved back down through the averages to the previous low.

Chart below:

 
I will update again when the next strategy trade has been identified.


GOLD: MONDAY 30TH SEPTEMBER 2013.15:32HRS

GOLD:

Gold is in a down trend.

Chart below:


Price has broken through the 4 hr trend line (chart below) and then retested it.
 
 
Price has now broken down through the averages and I am looking for a short position as detailed below.
 
Levels and Chart below:
 
1st entry: 1330.00
2nd Entry: 1332.00
 
Averaged entry: 1331.00
 
1st Target: 1301.00 (5%)
2nd Target: 1270.00 (10% and previous lows)
 
 
I will update again should the position be opened.


EUR / USD UPDATE: MONDAY 30TH SEPTEMBER 2013. 06:21HRS

EUR / USD:

Price has been unable to maintain its progress above the averages and I have been stopped at break even.

The high of the position was at 1.3564 (2%). This was a good position with good risk reward.
However, the forex markets are a tad range bound at the moment, and this is limiting the potential profit on each position.
There was 2% available on this position, 1.8% on the Gold trade from Tuesday last week and 1% on the Brent Oil position on Wednesday of last week.

The market will break and I will bank when the chart tells me to.

This is now a double top and if price breaks down with good momentum, I will consider the short trade.

Chart below:

 
I will update again when the next strategy trade has been identified.


Friday, September 27, 2013

EUR / USD UPDATE: FRIDAY 27THE SEPTEMBER 2013. 12:14HRS

EUR / USD:

EU has retraced back to the order level.

Price has now moved back up and made an immediate higher high.

This has allowed me to move the stop loss to break even, eliminating the risk on the position.

I am long with 1% exposure to the market with ZERO risk

Chart below:

 
I will update again later this afternoon.