Monday, September 30, 2013

GOLD UPDATE: MONDAY 30TH SEPTEMBER 2013. 19:01HRS

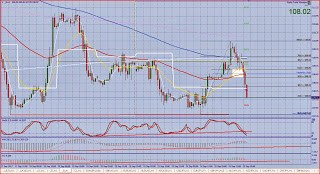
GOLD:

Price has retraced as expected. The first order has been hit.

I have removed the second order.

Price retraced 6 pips higher than I wanted and it has hit my stop loss for -0.5%

Price has now moved back down through the averages to the previous low.

Chart below:

 
I will update again when the next strategy trade has been identified.


GOLD: MONDAY 30TH SEPTEMBER 2013.15:32HRS

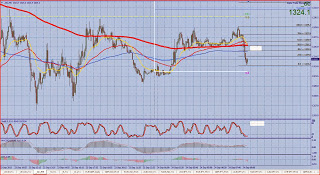
GOLD:

Gold is in a down trend.

Chart below:


Price has broken through the 4 hr trend line (chart below) and then retested it.
 
 
Price has now broken down through the averages and I am looking for a short position as detailed below.
 
Levels and Chart below:
 
1st entry: 1330.00
2nd Entry: 1332.00
 
Averaged entry: 1331.00
 
1st Target: 1301.00 (5%)
2nd Target: 1270.00 (10% and previous lows)
 
 
I will update again should the position be opened.


EUR / USD UPDATE: MONDAY 30TH SEPTEMBER 2013. 06:21HRS

EUR / USD:

Price has been unable to maintain its progress above the averages and I have been stopped at break even.

The high of the position was at 1.3564 (2%). This was a good position with good risk reward.
However, the forex markets are a tad range bound at the moment, and this is limiting the potential profit on each position.
There was 2% available on this position, 1.8% on the Gold trade from Tuesday last week and 1% on the Brent Oil position on Wednesday of last week.

The market will break and I will bank when the chart tells me to.

This is now a double top and if price breaks down with good momentum, I will consider the short trade.

Chart below:

 
I will update again when the next strategy trade has been identified.


Friday, September 27, 2013

EUR / USD UPDATE: FRIDAY 27THE SEPTEMBER 2013. 12:14HRS

EUR / USD:

EU has retraced back to the order level.

Price has now moved back up and made an immediate higher high.

This has allowed me to move the stop loss to break even, eliminating the risk on the position.

I am long with 1% exposure to the market with ZERO risk

Chart below:

 
I will update again later this afternoon.


EUR / USD: FRIDAY 27TH SEPTEMBER 2013. 11:29HRS

EUR / USD:

EU is in an uptrend.

Chart below:

 
Price has pulled back to the weekly pivot point where it has found support and formed a double bottom.
 
Chart below:
 
 
Price has this morning broken up through the averages and I am looking for a long position as detailed below.
 
Levels and chart below:
 
Entry: 1.3500
 
Stop Loss: 1.3470
 
Target: 1.3650 (5%)
 
 
I will update again should the position be opened.


Wednesday, September 25, 2013

BRENT OIL UPDATE: WEDNESDAY 25TH SEPTEMBER 2013 19:20HRS

BRENT OIL:

Price has been unable to hold above the averages and I have been stopped at break even.

Chart below:


I will update again when the next strategy trade has been identified.


BRENT OIL: WEDNESDAY 25TH SEPTEMBER 2013. 16.03HRS

BRENT OIL:

Price has retraced to the entry level.

The first order has been hit.

The second order was missed by 15 pips, therefore it has been removed

Price has moved away from the entry, and I am long with 0.5% exposure to the market.

I have moved the stop loss to break even to eliminate the risk on the position.

Chart below:


I will update again later this evening.


GBP / USD: WEDNESDAY 25TH SEPTEMBER 2013. 13:19HRS

GBP / USD:

Cable is in an uptrend.

Chart below:

 
Price has pulled back to form a double bottom.
 
Price has now moved back above the averages and I am looking for a long position as detailed below.
 
Levels and chart below:
 
1st Entry: 1.6030
2nd Entry: 1.6020
 
Averaged entry: 1.6025
 
Stop Loss: 1.5995
 
1st Target: 1.6175
2nd Target: 1.6300


I will update again should the position be opened.


EUR / USD: WEDNESDAY 25TH SEPTEMBER 2013. 11:45HRS

EUR / USD:

EU is in an uptrend.

Chart below:


Price has pulled back and formed a double bottom.
 
Price has now broken back up through the averages and I am looking for a long position as detailed below.
 
Levels and Chart below:
 
1st Entry: 1.3495
2nd Entry: 1.3490
 
Averaged entry: 1.3492
 
Stop Loss: 1.3470
 
1st Target: 1.3602 (5%)
2nd Target: 1.3700 (Previous high 9.2)
 
 
I will update again should the position be opened.


BRENT OIL: WEDNESDAY 25TH SEPTEMBER 2013. 11:34HRS

BRENT OIL:

Brent Oil is in an up trend.

Chart below:


Price has pull back from the highs and formed a double bottom.
 
There is also divergence between price and the Oscillating indicators.
 
Chart below:
 
 
Price has this morning broken back up through the averages and pivot points and I am looking for a long position as detailed below.
 
Levels and chart below:
 
1st Entry: 109.10
2nd Entry: 108.80
 
Averaged Entry: 108.95
 
Stop Loss: 108.40
 
1st Target: 111.70 (5%)
2nd Target: 117.00 ( Previous high) 14.6%
 
 
I will update again should the position be opened.


Tuesday, September 24, 2013

GOLD UPDATE: TUESDAY 24TH SEPTEMBER 2013. 19:20HRS

GOLD:

Price made a new low and went down to 1305.00

The target was in sight but unfortunately Gold has rallied and I have been stopped at break even.

Chart below:

 
I will update again when the next strategy trade has bee identified.
 
Have a good evening


GOLD UPDATE: TUESDAY 24TH SEPTEMBER 2013. 12:25HRS

GOLD:

Price has made its way down to yesterdays low at 1314.00.

The position is progressing well towards the target of 1297.50

The stop remains at break even for the now.

Chart below:


I will update again later this evening.

GOLD UPDATE: TUESDAY 24TH SEPTEMBER 2013. 07:59HRS

GOLD:

Price has retraced as expected.

The first order has been hit, the second order was missed by 2 pips.

I have removed the second order.

Price has now moved back down towards the previous low and I have moved the stop loss to break even to eliminate the risk on the position.

I am short with 0.5% exposure to the market with the stop loss at break even.

Chart below:

 
I will update again later today.


GOLD: TUESDAY 24TH SEPTEMBER 2013. 07:39HRS

GOLD:

Gold is in a down trend.

Chart below:

 
Price has pulled back to the 61.8% Fibonacci level and then broken down through trend line support.
 
Chart below:
 
 
I am looking for a short position as detailed below.
 
Levels and chart below:
 
1st Entry: 1325.00
2nd Entry: 1326.00
 
Averaged entry: 1325.50
 
Stop Loss: 1331.00
 
Target: 1297.50
 
 
I will update again should the position be opened.


Tuesday, September 17, 2013

AUD / JPY UPDATE: TUESDAY 17/09/13. 06:31HRS

AUD / JPY:

Price retraced back to the entry level and was making decent progress down to support.

Unfortunately a spike in the market has push price up and hit my stop loss.

I have been stopped for -0.5%.

Price is now back at the entry level.

I will look again at this short set up if price breaks through the support below.

Chart below:


I will update again when the next strategy trade has been identified.

Monday, September 16, 2013

AUD / JPY: MONDAY 16/09/13. 07:52HRS

AUD / JPY:

AJ is in a down trend.

Chart below:

 
Price has pulled back to to the 38.2% Fibonacci Level.
 
This morning price has broken down through the averages.
 
I am looking for a short position as detailed below:
 
Levels and Chart below:
 
1st Entry: 92.15
 
Stop Loss: 92.40
 
Target: 90.90 (2.5%)
 
I am looking to take a small position with 0.5% risk and will add to the position when price moves away from the entry level.
 
 
I will update again should the position be opened.


AUD / CAD UPDATE: MONDAY 16/09/13. 06:21HRS

AUD / CAD:

The market has rallied on the back of Summers withdrawal from the The Fed Chairmanship race.

Summers withdraws from Fed race
Lawrence Summers has taken himself out of the running to be the next chairman, withdrawing after opposition from key Democratic senators indicated they would oppose his nomination

I have been stopped on this position.

Chart below:


I will update again when the next strategy trade has been identified.

Friday, September 13, 2013

AUD CAD UPDATE: FRIDAY 13/09/2013. 16:04HRS

AUD / CAD:

There has been no change.

I am short from 0.9560 with 0.5% exposure.

The stop loss is at 0.9590 or 0.25% risk.

Price is at 0.9550. Price is still to close to the entry to move the stop loss to break even.

Looks like I will have to hold over the weekend.

I will try to push the stop if there is a little more selling before the close at 22:00hrs.

Big week next week with the Fed Meeting.

I will be looking to get involved on any crosses that take place.

In the mean time have a great weekend.

Chart below:


AUD / CAD UPDATE: FRIDAY 13/09/13. 06:27HRS

AUD / CAD:

Price has done very little over night.

However, it has moved slowly down and at the time of writing the price is 0.9546.

The spread is large (8pips) and this makes it hard to push the stop to break even.

Therefore I have moved the stop down to 0.9590. This leaves 0.25% risk.

I will move the stop to break even as soon as is practical.

Chart below:


I will update again later today.


Thursday, September 12, 2013

AUD / CAD UPDATE: THURSDAY 12/09/2013. 19:58HRS

AUD / CAD:

Price has pulled back to the first entry at 0.9560.

I am currently short with 0.5% exposure to the market.

Price is hovering around the entry. I am unable to move the stop loss at the time of writing.

I will hold the position and move the stop loss when the chart allows me to.

Chart below:


AUD / CAD: THURSDAY 12/09/2013. 08:41HRS.

AUD / CAD:

This cross is in a down trend.

Chart below:

 
Price has pulled back and has formed a triple top formation.
 
Chart below:
 
 
Price has now broken down through the averages, made a lower low and I am looking for a short position as detailed below.
 
Levels and Chart below:
 
1st Entry: 0.9560
2nd Entry: 0.9580
 
Averaged Entry: 0.9570
 
Stop Loss: 0.9605
 
1st Target: 0.9395 (5%)
2nd Target: 0.9170 (11.4%) Previous low
 
 
I will update again should the position be opened.


GBP / AUD: THURSDAY 12/09/2013. 08:29HRS

GBP / AUD:

This cross is in an up trend.

Chart below:

 
Price has pulled back to a previous level of support and formed a double bottom.
 
Price has now moved back up through the averages and I am looking for a long position as detailed below.
 
Levels and Chart below:
 
1st Entry: 1.7030
2nd Entry: 1.7010
 
Averaged Entry: 1.7020
 
Stop Loss: 1.6960
 
1st Target: 1.7320 (5%)
2nd Target: 1.7450 (7.16%) previous highs.


I will update again should the position be opened.


Tuesday, September 03, 2013

GBP / USD UPDATE: TUESDAY 03/09/2013. 16:37HRS

GBP / USD:

Price has retraced and the position has been closed for -0.125%.

Chart below:

 
I will update again when the next strategy trade has been identified.


GBP / USD UPDATE: TUESDAY 03/09/2013. 05:09HRS

GBP / USD:

Cable has slowly ground its way up over night.

I have moved the stop on the second order (1.5535) to break even.

I have moved the stop on the first order (1.5545) to 1.5536.

I remain long with 1% exposure to the market with 0.125% risk. (9 pips)

I will move to break even as soon as it is possible.

Chart below:

 
I will update again later this morning.


Monday, September 02, 2013

GBP / USD UPDATE: MONDAY 02/09/2013. 19:41HRS

GBP / USD:

Cable has retraced back to the order levels at 1.5545 and 1.5535.

I am long with 1% exposure to the market.

Price has slowed and almost stopped at the entry levels and I am unable to move the stop loss just yet.

I will watch price for a few hours and try to move the stops before I call it a night.

I will update again if I am able to do this or first thing tomorrow morning.

Chart below.


There is good data out this week with interest rates and NFP, therefore I am willing to give this position every chance to fulfil its promise.


EUR / JPY: MONDAY 02/09/2013. 14:08HRS

EUR / JPY:

EJ is in an uptrend.

Chart below:

 
Price has pulled back to the 61.8% Fibonacci level where it has formed a double bottom pattern.
 
Price has today moved back through the averages and I am looking for a long position with the trend.
 
Levels and Chart below:
 
1st Entry: 130.60
2nd Entry: 130.40
 
Averaged Entry: 130.50
 
Stop Loss: 130.00
 
Target: 133.00
 
 
I will update again should the position be opened.


GBP / USD: MONDAY 02/09/2013. 13:57HRS

GBP / USD:

Cable is in an up trend.

Chart below:

 
Price has pulled back to the 50% Fibonacci Level where it has found support off of a previous resistance level.
 
Price has now moved back up through the averages and I am looking for a long position with the trend.
 
Levels and chart below:
 
1st Entry: 1.5545
2nd Entry: 1.5535

Averaged entry: 1.5540

Stop Loss: 1.5500

Target: 1.5740

 
I will update again should the position be opened.