Friday, May 30, 2014

AUD / USD UPDATE Friday30th May 2014. 06:43hrs

AUD / USD:

Price retraced and my first order at 0.9280 was hit.

Price has now moved up to 0.9325.

I have removed the second order and move the stop loss on the open position to break even. 0.9280

This has eliminated the risk on the position.

I have a limit order at 0.9475 to take profit.

I will trail the stop up, locking in profit over the next day or so.

I will update again when I do so.

Chart below:

 
Namaste
 
MDT

Thursday, May 29, 2014

AUD / USD: Thursday 29th May 2014. 13:06hrs

AUD / USD:

Aussie is in an up trend.
The market is held up by a strong level of support at 0.9200.

Chart below:


Price has moved away from the support and the averages have crossed to the upside.
 
I am looking for a long position in line with my ATC strategy.
 
Levels and chart below:
 
1st Entry: 0.9280
2nd entry: 0.9270
 
Averaged entry: 0.9275
 
Stop Loss: 0.9235
 
Target: 0.9475.
 
 
I will update again when I am moving the stops to eliminate the risk.
 
Namatse
 
MDT
 

Wednesday, May 28, 2014

AUD / USD: Wednesday 28th May 2014. 15:49hrs

AUD / USD:

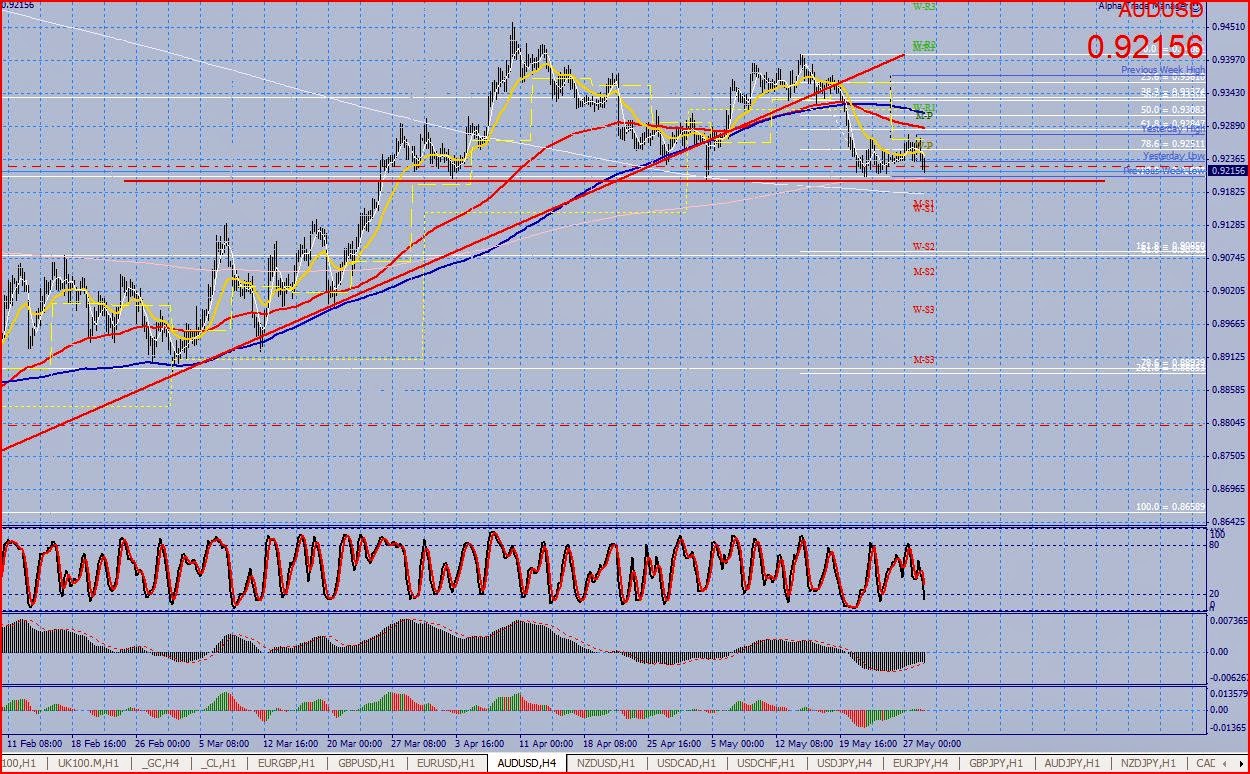
A decent support level is being tested on Aussie.

If it fails to hold......

Chart below:


I have an order below the support at 0.9195

Wednesday, May 07, 2014

Gold: Wednesday 07/05/2014. 17:06hrs

Gold:

Gold has been in a downward channel for the past few weeks.

Chart below:

 
There is a clear support level at 1270 area but I am happy to short into this from the 1300 area.
 
I have a short order as detailed below.
 
Levels & chart below.
 
1st Entry: 1300.00
2nd Entry: 1303.00
 
Averaged Entry: 1301.5
 
Stop Loss: 1307.00
 
Target: 1274.00
 
 
Namaste
 
MDT


Friday, April 25, 2014

Cable GBP / USD: Friday 25th April 2014. 14:42hrs

GBP / USD:

Cable has been consolidation for the past week or so. Although price has been slowly drifting up there are some signs that a reversal may be around the corner.

From the chart below you can see that price has remained below the 1.6850 level and that there is a divergence between price making Higher highs and the oscillating indicators.

Chart below:

 
I would like to see price hold below below 1.6850 and make a move lower through 1.6750.
Once the lower low is in place the averages will have crossed over and I will look for a short on the pull back.
 
Chart below:
 
 
I will update again should price break down and I decide to enter a position.
 
Have a great weekend.
 
Namaste
 
MDT


Thursday, April 17, 2014

EUR / JPY Update: 17th April 2014. 11:52hrs

EUR / JPY:

EJ has retraced as expected and made a nice move higher to 141.50.

I have moved my stop to break even, thus eliminating the risk on the position.

The chart is showing a cheeky bullish 15 minute cross, therefore I may add in when the pullback to the averages takes place.

I do have in the back of my mind the Easter break and I may just hold what I have over the weekend.

If I do decide to add in, I will post the levels.

Chart below:


Have a great long weekend.
 
Namaste
 
MDT

Wednesday, April 16, 2014

EUR / JPY: Wednesday 16th April 2014: 11:05hrs

EUR / JPY:

EJ is in a bit of a range.

Chart below:


However, Following the move last night and the immediate Higher High I feel there is a decent opportunity using the ATC strategy.
 
I am looking for a long position as detailed below.
 
Levels and Chart below:
 
Entry: 141.05
 
Stop Loss: 140.75
 
Target: 142.55 (5%)


I will update again should the position be opened.
 
Namaste
 
MDT
 

Wednesday, April 09, 2014

GBP / JPY: Wednesday 9th April 2014. 12:51hrs

GBP / JPY:

Price has been making lower lows and lower highs since the 3rd of April 2014.

Price has been consolidation just above the Daily Pivot Point (DP) at 170.80 area.

I am looking for a break of the DP to enter a short position with the shorter term trend.

Levels and Chart below:

Entry: 170.65

Stop: 171.05

Target: 168.00


I hope you are having a great week
 
Namaste
 
MDT

Wednesday, April 02, 2014

NZD / USD: Wednesday 2nd April 2014. 07:52hrs

NZD / USD:

Price has formed a double top formation on the 60 minute chart.

Price has broken down, made a new low and the averages have crossed over.

I am looking for a short position as detailed below.

Levels and chart below:

1st Entry: 0.8625
2nd Entry: 0.8640

Averaged Entry: 0.8632

Stop Loss: 0.8672

Target: 0.8432

 
I will update again when the position has been opened.
 
Namaste
 
MDT

Monday, March 31, 2014

USD / CHF UPDATE: Monday 31st March 2014. 15:13hrs

USD / CHF:

My first order at 0.8850 has been triggered.

I am short with 0.5% exposure to the market.

Price has moved down by 15 pips and I have moved my stop loss to break even, eliminating the risk on this position.

Chart below:

 
I will update again when we approach the first target.
 
Namaste.
 
MDT

USD / CHF: Monday 31st March 2014. 13:45hrs

USD / CHF:

Swissy is in a down trend.
Price has recently pulled back to a level that has previously been a resistance level and formed a Double Top.

Chart below:


There is some nice divergence between price and the oscillating indicators on a 60 minute chart.

Chart below:


Price has today broken down through the averages and I am looking for a short position when price pulls back and the 60 minute stochastic is above 50.

Levels below:

1st Entry: 0.8850 (0.5%)
2nd Entry: 0.8860 (0.5%)

Averaged entry: 0.8855 (1% Maximum Risk)

Stop Loss: 0.8890

1st target: 0.8790
2nd Target: 0.8680 (5%)

I will update again should the position be opened and I move the stop loss to Break even.

Have a great week
Namaste
MDT

Thursday, March 27, 2014

USD / CHF: Thursday 27th March 2014. 15:06hrs

USD / CHF:

Swissy is in a clear down trend. Price is making lower highs and lower lows on the daily chart

Chart below:


Price has recently retraced and tested the Monthly Pivot Point (MPP)
 
Price has been unable to break the MPP on 5 occasions.
 
If (and it remains an if for the moment) price can break down and make a lower low through the averages, when price pulls back I will be looking to take a short position.
 
I will update again with the levels if and when price makes a move lower.
 
Chart below.


Hope you are all still long WTI.
 
Regards
 
MDT


Tuesday, March 25, 2014

EUR / JPY: Tuesday 25th March 2014. 10:57hrs

EUR / JPY:

EJ remains in a long term up trend.

Price has been consolidating since the 13th March. At some point price will make a break out of the range.

If it break to the upside or the down side it does not matter so long as we remain sharp and enter when the market is moving.

I have marked n the chart below the range parameters.

Let price break and play the pull back in line with ATC.

Chart below.

 
Have a good day
 
Regards
 
MDT


Monday, March 24, 2014

Dow Jones Ind 30 UPDATE: Monday 24th March 2014 18:21hrs

Dow Jones Ind 30:

Price has retraced to the entry level of 16220.

My order has been triggered and I am short.

Price has moved away from the entry nicely by 25 pips allowing me to move the stop loss to break even eliminating the risk on this position.

Chart below:

 
I will update again tomorrow.
 
Regards
 
MDT

DOW JONES IND 30: Monday 24th March 2014. 15:35hrs

DOW JONES IND 30:

The Dow has formed a nice double top at 16500.

Chart below:

 
I am looking for a way to get short.
 
Price has this afternoon broken down and on the short term charts (15 minute) I have been given a cross of the short term averages through the medium term averages,
 
This is the signal I have been waiting for.
 
I am going to short the Dow as detailed below.
 
Entry: 16220
Stop: 16260
1st Target: 15900
 
Chart below:


Have a great week.
 
Regards
 
MDT
 

Wednesday, March 19, 2014

EUR / JPY: Wednesday 19th March 2014. 16:48hrs

EUR / JPY.

EJ is in a long term up trend.

The 4 hr chart shows making Higher Highs and Higher Lows.
Price has pulled back to the 61.8% Fibonacci level where it has found support and moved higher again.

There is a nice trend line below supporting EJ also.

Chart below:

 
On the 60 minute chart price has again retraced to the 61.8% Fibonacci support and the trend line.
 
Should price break up through yesterdays high I will be looking for a long position.
 
Should price break the trend line to the down side I will look for a short position.
 
Chart below:
 
 
The Fed Interest Rate decision and Fed monetary policy decision is out at 18:00hrs so the market will remain slow until the news.
 
Once we get the break, look to capitalise on the this break out opportunity.
 
I will update again after the news with my trade levels.
Have a fun evening.
 
Regards
 
MDT.


Thursday, March 06, 2014

GOLD UPDATE: Thursday 6th March 2014. 15:40hrs

Gold:

After 3 days of sideways price action Gold has finally moved out of the consolidation and into a nice profitable position.

To remind you I am long from 1335 and 1339 Averaged in at 1337.

My stop loss was at 1331.

Price has now moved up to 1346 into profit by 1.5%.

I have now moved the stop loss on both position to 1337 eliminating the risk on the position.

I am happy to hold this position with no risk through the NFP numbers tomorrow.

Chart below:

 
I will update again after the NFP number has been released.
 
Have a good evening
 
Regards 

MDT

Monday, March 03, 2014

Gold: Monday 3rd March 2014. 10:06hrs

Gold:

Gold has been trending up for the most part of 2014.

Chart below:

 
Price has begun to move higher again following a small period of consolidation.
 
Price has made a new high this morning driving a cross in the moving averages.
 
I am looking for a long position as detailed below.
 
Levels and Chart below:
 
1st Entry: 1339.00
2nd Entry: 1335.00
 
Averaged Entry: 1337.00
 
Stop Loss: 1330.00
 
1st Target: 1372.00
2nd Target: 1432.00
 
 
I will update again should the position be opened.
 
Have a great week.
 
Regards.
 
MDT


Thursday, February 27, 2014

EUR / JPY UPDATE 7.5% profit at market: Thursday 27th February 2014. 10:42hrs

EUR / JPY:

EJ has continued to move down.

With USD / JPY breaking out of the wedge I am hopeful this trade is going to move toward my end target.

The first position (short 140.25) is in profit by 125 pips or 3.57%

The second position (short 140.00) is in profit by 100 pips or 4%.

Chart below:


Personally I am happy to hold through the pull back and look to add again.
 
However a profit of 7.5% is very good and you may consider closing here or at least taking some money off the table.
 
As I said I will look to add in again if we see another strong push down.
 
I will update you should I place another stop sell order.
 
In the mean time have a great day.
 
Regards
 
MDT
 

EUR / JPY UPDATE: Thursday 27th February 2014. 08:22hrs

EUR / JPY:

My second order has been triggered at 140.00 and I have moved the stop loss on both positions to 140.00.

This has locked in 25 pips on the first position and break even on the second.

Price has made a new low through 139.60 and I am happy to hold these positions with out any risk.

My end target is 136.40.

Chart below.


Hope you guys managed to jump on board.

Have a great day

MDT

EUR / JPY UPDATE: Thursday 27th February 2014. 07:50hrs

EUR / JPY:

Having moved the stop loss to break even on the first position (140.25) I am able to trade again on the next move down without taking on additional risk.

Price has consolidated over night and a break of 140.00 should see price retest the lows at 139.60.

Levels and chart below:

I have a stop sell order at 140.00 with a stop loss at 140.25.

 
Regards
 
MDT

EUR / JPY UPDATE: Thursday 27th February 2104. 07:36hrs

EUR / JPY:

The first order was pip perfect in its location at 140.25.

Price has moved away from the entry overnight and I have moved the stop loss to break even eliminating the risk on the position.

Chart below:

 
I will be looking to add into the position when we get another move down.
 
I will post again should this develop.
 
Regards
MDT

Wednesday, February 26, 2014

EUR / JPY: Wednesday 26th February 2014. 16:49hrs

EUR  / JPY:

EJ has been retracing and consolidation over the past few weeks.

Price has finally found a top at the 50% Fibonacci level.

Chart below

 
This afternoon price has broken down and a cross in the 60 minute averages has taken place.
 
According to my trade plan, I can now consider taking a short position on a pull back.
 
The only concern is the trend line support below, that however is around 60 pips from my first entry level. As the stop is going to be around 35 pips on average, I am happy to trade into the support moving my stop loss to eliminate the risk well before we test that area again.
 
Levels and chart below.
 
1st Entry: 140.25
2nd Entry: 140.45
 
Averaged entry: 140.35
 
Stop Loss 140.70
 
1st Target: 138.60 (5%)
2nd target: 136.40 (Previous lows)


After a very slow start to the week, lets hope this can make us some money.
 
Regards
 
MDT


Monday, February 24, 2014

EUR / USD: Monday 24th February 2014. 14:13hrs

EUR / USD:

EU is in an ascending channel.

Chart below:


Price has been rejected at 1.3770 and a Double top formation is in play on the 60 minute time frame.

If price can break the trendline support and make a new low I will be looking to enter short on a pull back to the resistance level that used to be support.

Chart below:


I will update again with entry levels should the brake take place.
 
Have a great week
 
MDT


Thursday, February 13, 2014

DOW Jones US30: Thursday 13th February 2014. 10:20hrs

Dow Jones US 30:

The Dow is in a longer term up trend

Chart below:

 
Price was rejected from the 16500 area in January and made a nice move Dow the 38.2% Fibonacci retracement level at 15280.
 
Price has since been retracing back up to the 38.2% Fibonacci level and round number at 16000.
 
Chart below:


Price has consolidated at little at this level and the averages have now crossed over to the downside.
 
On the 60 minute chart price has begun to make Lower Lows and Lower highs.
 
I am looking for a short position as detailed below.
 
Levels and Chart below:
 
Entry: 15845
 
Stop Loss: 15885
 
1st Target: 15805 (Break even)
2nd Target: 15745 (100 pips)
3rd Target: 15280 (Previous Lows)
 
I will update again when the position has been opened.
 
Regards
 
MDT


Tuesday, February 11, 2014

CAD / JPY: Tuesday 11th February 2014. 07.43hrs

CAD / JPY:

CJ has been trending down on a daily chart.

Chart below:

 
Following a small pull back, I am now considering short positions.
 
My moving averages have crossed to the short side and I am looking for a short position as detailed below.
 
Levels and Chart below:
 
Entry: 92.05 (1%)
 
Stop: 92.45
 
1st Target: 90.90 (2.9%)
2nd Target: 89.30 (6.9%)
Final target: 88.00 (10.1%)
 
 
I will move the stop to break even eliminating the risk on the position when price tests 91.75
 
I will update again when the position has been opened.
 
Regards
 
MDT
 

Monday, February 10, 2014

GBP USD Update: Monday 10th February 2014. 08:15hrs

GBP / USD:

Should cable fail to pull back to the desired entry levels (see previous post) then I will look to enter long on a break of the swing high at 1.6426.

Chart below:

 
Regards
 
MDT

GBP / USD: Monday 10th February 2014. 07:09hrs

GBP / USD:

Cable is in an up trend.

Price retraced from the high to a previous Resistance level at 1.6250.

This also the Daily 100 Period Moving average.

Chart below:

 
Price has now begun to move higher and the averages have crossed back to the upside.
 
I am looking for a long position on a pull back to over lapping support as detailed below.
 
Levels and chart below:
 
1st Entry: 1.6380
2nd entry: 1.6370
 
Averaged Entry: 1.6375
 
Stop Loss: 1.6340
 
1st Target: 1.6500
2nd Target: 1.6620
3rd Target: 1.7000
 
I will be moving the stop loss to break even eliminating the risk on a test of 1.6425
 
I will update again when the position has been opened.
 
Have a great week.
 
MDT

Friday, February 07, 2014

EUR / JPY Update: Friday 7th February 2014. 18:21hrs

EUR / JPY:

EJ has as expected pulled back and pick up my first order.

I am long from 138.25.

Price has moved back above the swing high I used to draw the Fibonacci Retracement yesterday at 138.80. This has allowed me to move my stop loss to break even and eliminate the risk on the position.

Chart below.

 
I will hold the position over the weekend and update again on Monday.
 
Have a great weekend
 
Best Regards
 
MDT
 

Thursday, February 06, 2014

EUR / JPY: Thursday 6th February 2014. 16:46hrs

EUR / JPY:

EJ is in a long term up trend.

Price has been driven lower by the recent sell off in the US stock market.

Price has found support at the 61.8% Fibonacci retracement level.

Chart below:

 
Price has to day broken up and out of the narrow consolidation range.
 
The moving averages have crossed to the upside.
 
I am looking for a long position when price pulls back with the main trend as detailed below.
 
Levels and Chart below:
 
1st Entry: 138.10 (0.5%)
2nd Entry: 137.90 (0.5%)
 
Averaged Entry: 138.00 (1%)
 
Stop Loss: 137.40
 
1st Target: 140.40 (5%)
2nd Target: 141.20 (PWH & 8%)
3rd Target: 145.50 (145.50 & 18.75%)
 
 
I will be moving the stop loss to break even to eliminate the risk, when the position breaks the swing high at 138.80.
 
I will update again when the position has been opened.
 
Have a great day.
 
Kind Regards
Scott Fitzgerald

Mad Dog Trader
Conservative, Repeatable,
High Probability, Trading Opportunities.


Wednesday, January 29, 2014

AUD / JPY: Wednesday 29th January 2014. 11:24hrs

AUD / JPY:

AJ had been in a consolidation for most of 2014, with support at 91.00.

At the end of last week price broke through the support level at 91.00.

For the most part of this week price has retraced the move back to 91.00.

Chart below:

 
The retracement also coincides with the 61.8% Fibonacci level of the downward move.
 
This is a good place to look for shorts.
 
Once my averages have crossed over I will be looking to enter short after a pull back.
 
Chart below:
 
 
The targets for this position are as follows.
 
T1: 86.00
 
T2: 81.50
 
T3: 75.00
 
Once the averages have crossed and the pull back is taking place, I will post again with my entry and stop loss levels.
 
Have a great day.


Tuesday, January 14, 2014

GBP / USD: Tuesday 14th January 2014. 09:45hrs

GBP / USD:

Price has retraced as expected and picked up both orders at 1.6430 and 1.6410.

Following the inflation report price has made a move down allowing the stops to be moved to break even.

Chart below:


I have limit orders as previously discussed to scale out profits.

Monday, January 13, 2014

GBP / USD: Monday 13th January 2014. 16:06hrs

GBP / USD:

Sterling has come under pressure overnight and through the European trading sessions.

Cable has made a nice push lower and I am looking to enter short on a pull back to the averages and Fibonacci levels as shown below.

Chart and Levels below.

1st Entry: 1.6410
2nd Entry 1.6430

Averaged Entry: 1.6420

Stop Loss: 1.6470

1st Target: 1.6240
2nd Target: 1.6070
3rd Target: 1.5800

 
I will be risking 1% of my account as always.