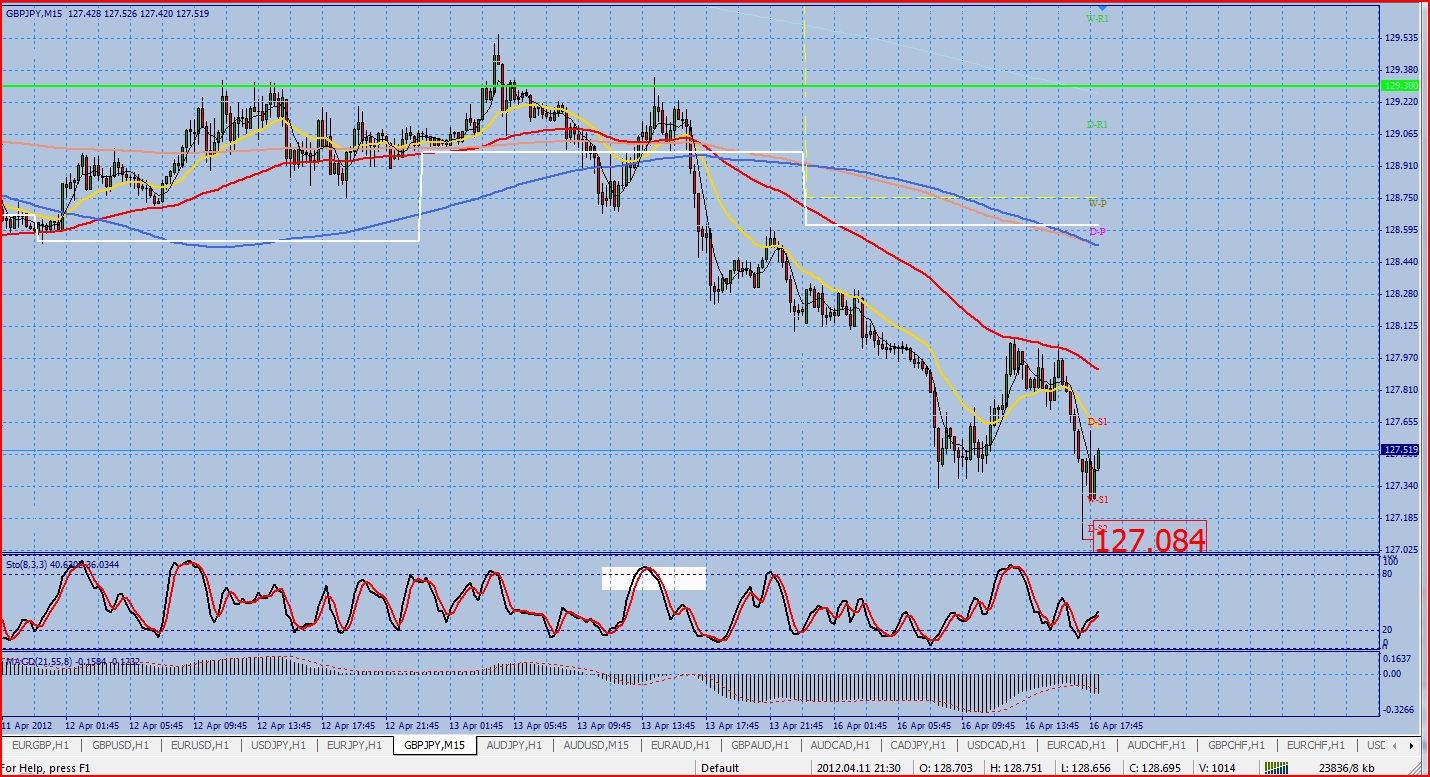
Thursday, April 26, 2012

EURO / JPY Thursday 26th April 2012 16:29hrs

Euro / JPY

Price did not pull back enough to offer a good risk reward entry. I needed an entry at 107.15.
The pull back topped out at 107.03 (12 pips)

I have removed my order.

Chart below


I will update with the next strategy trade once it has been identified.

Regards

Scott

AUSSIE / JPY Update Thursday 26th April 2012 16:19hrs

Aussie / JPY

Price has moved down to a low of 83.54 (2.2%)

However positive news from the USA with "Pending home sales" expected at 1.2% increase actual 4.1% increase and "Unemployment Claims" expected at 374K actual 388K

This positive news has pushed equities higher and in turn weakened the YEN.

This weakened YEN has produced a pull back to the entry level and I have been stopped out at break even by the spread. High of 83.94 on the pull back.

Price is now back down in the 83.70's and I expect a retest of support at 82.95 without me.

Chart below.


Still nothing lost and I managed to nick 5 pips to cover some small expenses.

I will update when the next strategy trade develops.

Have a good evening

Regards

Scott

AUSSIE / JPY Update Thursday 26th April 2012 13:34hrs

Aussie / JPY

I have been triggered in to the trade and I have moved the stop to break even to eliminate the risk.

The target is in place at 82.95 for 5%.

Chart below


I will update later this evening on the progress of this position.

Regards

Scott

AUSSIE / JPY Thursday 26th April 2012 12:07hrs

Aussie / JPY

This instrument has been trending down for the past 6 weeks.

Price has retraced to the 38.2% fib level of the ;last move down from a high of 88.60 to a low of 82.45

Chart below


Price has found resistance at 84.35 and a double top formation is in play.

Price has broken down through the averages and I am looking to enter short on a pull back to the averages with an overbought stochastic.

Entry levels and chart below

Entry: 83.95

Stop: 84.15

Target 82.95


Price has pulled back but the stochastic is still not at the correct level.

If this is the case I may hold off the short until I see confirmed resistance at my entry level.

I will update if and when a trade is entered.

Regards

Scott

Euro / JPY Thursday 26th April 2012 11:31hrs

Euro / JPY

This instrument has been trending down for the past 6 weeks. Price has pulled back 50% of the move from 111.40 high to a low of 104.60.

Chart below


Price has stalled at 107.60 and a triple top formation is in play.

Price has now broken down through the averages and I am looking to enter a short position with the main trend.

I will enter the trade on a pull back to the averages and fib level with an over bought stochastic.

I may need to adjust these levels as the morning progresses as the pullback is not yet confirmed

Entry and chart below.

Entry: 107.15

Stop: 107.40

Target: 105.90


I will update once the trade is triggered.

Regards

Scott

Tuesday, April 24, 2012

CAD / JPY Update Tuesday 24th April 2012 15:55hrs

CAD / JPY.

Price has been unable to maintain any downward momentum and I have been stopped at Break even.

Chart below


I am looking for the next strategy trade and will update once it has been identified.

Regards

Scott


USD / JPY Update Tuesday 24th April 2012 06:24hrs

USD / JPY

Price did not pull back far enough to allow a good risk reward entry.

My entry was at 81.35 and price only managed to get to 81.19

I have removed the order to open and will look for another strategy trade elsewhere.

Chart below


Regards

Scott

CAD / JPY Update Tuesday 24th April 2012 06:20hrs

CAD / JPY

The trade has been triggered and price has moved down by almost 1%.

I have moved the stop to break even, eliminating the risk on this trade.

Chart below


I will post again later today, with an update on the progress of this position

Regards

Scott

Monday, April 23, 2012

USD / JPY Monday 23rd April 2012 13:34hrs

USD / JPY

This pair is in a down trend

Chart below


As you can see from the chart, price has pulled back and bounced off of the trend line.

Price has broken back down through the averages and is looking to test the support level of 80.30.

I am looking to enter short on a pull back to the averages and fib levels.

Chart and levels below

Entry: 81.35

Stop: 81.55

Target: 81.35 (5%)


I will update once the trade has been triggered.

Regards

Scott

CAD / JPY Monday 23rd April 2012 12:06hrs

CAD / JPY

This pair has been trending down since mid March.

Chart below


Price has formed a triple top formation at 82.50 area.

Price has broken down through the averages and is looking like it will test support at 80.15.

I am looking to enter short on a pull back to the averages later this afternoon or tomorrow morning.

Levels and Chart below.

Entry: 81.80

Stop: 82.10

Target: 80.30 (5%)


I will update once the trade has been triggered.

Regards

Scott

Thursday, April 19, 2012

Sterling Aussie from 17/04/2012 Update

Sterling / Aussie.

I attempted a long on this currency cross on Tuesday as below.

Entry: 1.5350

Stop: 1.5315

Target 1.5525 (5%)

Chart below


Unfortunately I was stopped out on Tuesday afternoon.

Chart below


Price made a low of 1.5290 and then without me, made the move up that I had hope to profit from.


The target of 1.5525 has been hit this afternoon.


This is obviously very frustrating, however I think it is worth while pointing out, that once again the strategy showed the way with direction.

Chart below


This is not the first time that I have had a lean spell and I am sure it wont be the last time either.

For me thing to do is to sit on my hands, wait patiently for the correct strategy trade, with good risk reward to present itself and then nail it.

I am still looking for said trade and I will update once it has been identified.

I hope you are having a good week.

Best Regards

Scott


Wednesday, April 18, 2012

GBP / AUD Update Wednesday 18th April 2012 06:32 hrs

Price has been unable to to hold above the averages and i have been stopped for -1%

Chart below


I will update as soon as the next strategy trade is identified.

Regards

Scott

Tuesday, April 17, 2012

GBP / AUD tuesday 17th April 2012 10:04hrs

Sterling / AUD.

This pair has been trending up since mid February.

Price has retraced 61.8% of the previous up move and has found support at 1.5260.

Chart below


Price has held 1.5260 and formed a triple bottom.

Price has now broken back up through the averages and a good opportunity to get long with the trend is setting up.

I am looking to go long when the stochastic is oversold and on a pull back to the averages, pivot points and fib level

Entry levels and chart below.

Entry: 1.5350

Stop: 1.5315

Target: 1.5525.


I will update once the trade is triggered.

Regards

Scott


Sterling Yen Trade from 13/04/2012 Update

This is for information purposes only.

The trade has hit the 5% target at 127.20

Chart below.


Regards

Scott

Aussie / JPY and CAD / JPY Tuesday 17th April 2012 06.32 hrs

AJ & CJ

These pairs have not really moved since yesterday and I have backed away from the shorts for the moment.

I will update again as soon as a strategy trade is identified.

Charts below.

AJ


CJ


Regards

Scott


Monday, April 16, 2012

AUD / JPY Monday 16th April 2012 10:20hrs

Aussie / JPY

This pair has been trending down in a similar way that CAD / JPY has from 21/03/2012

Chart below


Once again price has pulled back and has been rejected at around 84.50 and the trend line above.

Price has broken back down through the averages and is looking as though it will continue the current trend down to support.

I am looking to enter short when price has pulled back and the stochastic has returned to the overbought region.

Chart below


I will update with the entry levels once the pull back is on.

Regards

Scott


CAD / JPY Monday 16th April 2012 10:02hrs

Cad / JPY

Cad / Jpy has been trending down since the swing high was put in on 21/03/2012.

Chart below


Price pulled back last week and has now shown signs of continuing with the downward trend in the form of a double top at 81.63

A cross of the averages has taken place and I am looking to enter short.

I do not have the levels just yet as the chart is still oversold and I need price to pull back further to offer a better risk reward play.

Chart below


I will update once price and the stochastic has begun the pull back towards the averages.


Regards

Scott

Friday, April 13, 2012

Sterling Yen Friday 13th April 2012 15.19hrs

Sterling Yen.

As I said in my previous post, my stop loss was hit on this trade at 129.30.

I thought I would just show you what the chart looks like now at 15.20hrs.

Charts below

Entry 10:53hrs


Stopped out 12:33hrs


Break even 15: 20hrs


As you can see the high on the chart is 129.343. My stoploss was at 129.30

I was spiked out of the trade by 4.3 pips.

The trade is now in profit by over 1%, with the potential to reach the 5% target early next week.

Whether this trade hits the target or not is no longer relevant, however this trade would now have the stop at break even and the risk would have been eliminated.

I know it doesn't count for much now, but I felt I should point this out.

I am looking forward to next week, when I am expecting some more predictable markets that are not so choppy.

I finish this week -2%

I am sure I will get this back in the very near future and expect to be running a profit on the book by the month end.

I hope you all have a very nice weekend.

Best Regards

Scott

Sterling / Yen Friday 13th April 2012 12:39hrs

GJ

I can confirm I have been stopped on this trade for -1%

Chart below


Regards

Scott

Sterling Yen Friday 13th April 2012 09:52hrs

Sterling Yen (GJ)

Price has broken back through the averages and I am looking to enter short when the stochastic is in the over bought region.

Chart and levels below.

Entry: 128.95

Stop: 129.30

Target: 127.20 (5%)


I will update if and when the trade is triggered and I am in a position to move the stop loss to break even

Regards

Scott

YEN Crosses. Friday 13th April 2012 07:05hrs

Yen Pairs.

Good morning.

China 1Q GDP came out showing much lower figure than expected. 1Q China GDP showed a +8.1% increase while consensus estimated a 8.4% rise, and even some rumour's ahead of the event called for a 9% climb.
I am watching the the following currency crosses for continuation moves with the trend following the recent pull backs.

Euro / JPY


GBP / JPY


AUD / JPY


Once price breaks back down through the averages, I will wait for the pull back before entering short to test support levels below.

I will update with entry levels, stops and targets when the trades have developed.

Regards

Scott

Thursday, April 12, 2012

USD instruments are range bound Thursday 12th April 2012 07:40hrs

Good morning,

The USD instruments are range bound right now.

Clearly there has been some movement, however moving averages are not much use in these type of conditions.

The Yen pairs are still looking bearish, however before I can trade them; I need a decent pull back before a cross back down with the trend.

There is some better news out today and tomorrow, so there is still a chance we may get a strategy trade before the weeks out. http://www.forexfactory.com/calendar.php

If not then I will wait patiently until a trade is offered up, with good risk reward.

August, Christmas and Easter have been like this in the past and then things pick up a week or so after the holidays.

Charts below.

Euro / USD


Cable


USD / Swiss


Kiwi


I will post again as soon as a strategy trade sets up

Hope you are having a good week

Regards

Scott

Tuesday, April 10, 2012

Cable. Tuesday 10th April 2012 08:22hrs

Cable.

Price has not maintained above the averages or pivot points and I have been stopped for -1%

Chart below


I am actively looking for the next strategy trade and will update once it has been identified.

Regards

Scott

Cable. Tuesday 10th April 2012 07:10 hrs

Cable.

All though there was USD strength in the market last week, Cable has remained in a supported market.

The 4 hour chart shows trend line support below and price has put in a higher high at 1.6060.

Chart below.


Price has broken back above the averages and pivot points and made an immediate higher high on the 60 minute time frame.

I am looking to enter a long position should we get a pull back to the averages with a stop loss below the Daily 20 EMA.

Chart and levels below.

Entry: 1.5890

Stop: 1.5865

Target: 1.6015


I will update later as the trade develops.

Regards

Scott


Thursday, April 05, 2012

Cable Thursday 5th April 2012 10:36hrs

Cable.

Price has been to within 1.4 pips of my order.

Price has made a new low without picking up the order.

My order has been removed and I will re asses the trade if we get another pull back.


I will post again when the next strategy trade sets up

Regards

Scott

Cable Thursday 5th April 2012 10:14hrs

Cable.

Price has broken back down and the short term averages have crossed to the down side.

There is a resistance level at 1.5908 and a lower low through the daily pivot.

Price is showing signs of continuing with the prevailing down trend.

I will enter a short at 1.5885 with a stop above resistance at 1.5915.

Levels and chart below.

Entry: 1.5885

Stop: 1.5915

Target: 1.5735 (5%)


Cable, EU & Kiwi. Thursday 5th April 2012 07:18hrs

Cable.

The pull back has still not arrived and we now have a short term cross against the trade direction.

Chart below


I have removed my order to go short for the time being.

I have not given up on the trade, I would just prefer to enter when the market is moving back in the desired direction. I am looking for a price to break back down through the Daily Pivot (DP White solid line) 1.5875. I will update with the levels later.

EU

This is in the same position as Cable and the short term price action is bid so order removed for now.

Chart below


Looking to enter on the break back down.

Kiwi

Short term price action is bid looking to enter on the break of DP 0.8154 area.

Chart below


I will update as and when I enter short positions

Regards

Scott

Wednesday, April 04, 2012

Kiwi / USD Wednesday 4th April 2012 07:31hrs

Kiwi / USD.

Kiwi has resistance at 0.8280 and a double top formation at 0.8260.

Chart below


Following the bout of USD strength a cross of the averages has taken place and a short opportunity has developed.

There is trendline support below, however this is 50 pips from the entry.

I will move the stop to break even before we test this area to remove the risk from the trade.

If we get the pull back, I will be looking to enter short at the levels below

Chart and entry levels below.

Entry: 0.8205

Stop: 0.8225

Target: 0.8105


Regards

Scott

Euro / USD Wednesday 4th April 2012 07:22hrs

Euro / USD.

As mentioned in previous posts, EU has significant resistance at 1.3380. However price was caught in an ascending triangle and I have been waiting for the break out of the triangle before trading this pair.

Chart below


The break has taken place following the news last night.

If we can get a pull back to the averages and pivot points then I will be looking to enter short.

Entry levels and chart below

Entry: 1.3265

Stop: 1.3305

Target: 1.3065


I may have to adjust these levels as the pull back develops, however this is the area that looks most likely at the time of writing.

Regards

Scott